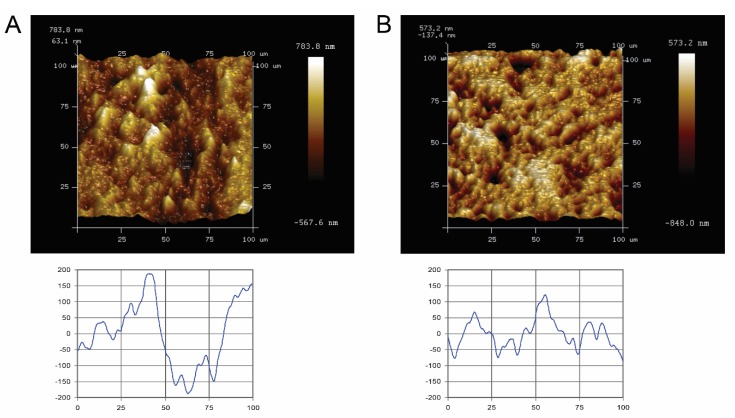
Figure 1.
Atomic-force microscopy (AFM) images of representative specimen surfaces (100 × 100 µm2, upper panel), and corresponding scan profiles (lower panel) of the tested blocks. (A) titanium and (B) ceramic. Bright areas indicate high points, and dark areas indicate low points across the surface. (Lower graph: X- and Y-axes measured in micrometers).

