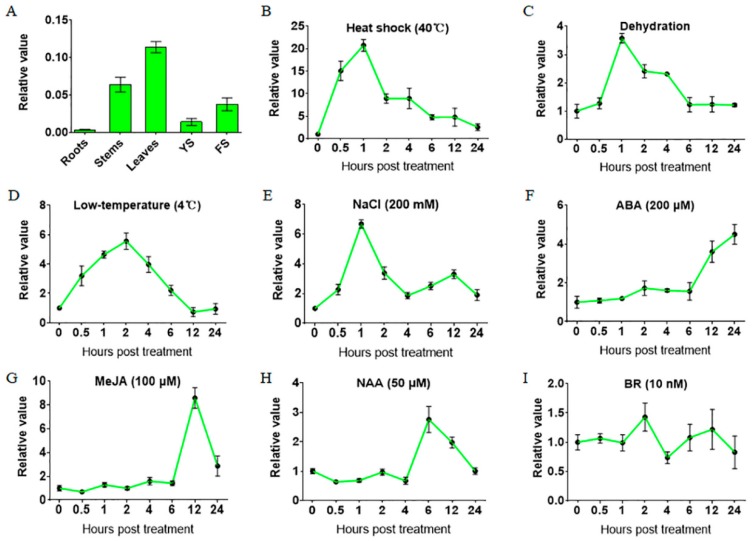
Figure 1.
Gene expression patterns of TaHsfA6f. (A) Relative expression levels of TaHsfA6f in various wheat organs. Total RNA was isolated from roots, stems, leaves, young spikes (YS), and flowering spikes (FS). The data represent means of three biological replicates ± SD. (B-I) Gene expression patterns of TaHsfA6f during abiotic stresses and phytohormones. Total RNA was extracted from plants treated with 40 °C heat shock (B), dehydration (C), 4 °C low temperature (D), 200 mM NaCl (E), 200 µM ABA (F), 100 mM MeJA (G), 50 mM NAA (H), and 10 nM BR (I), for the indicated time points. The relative expression level was measured by qPCR and calculated by the comparative CT method. Error bars indicate standard deviations (SD).

