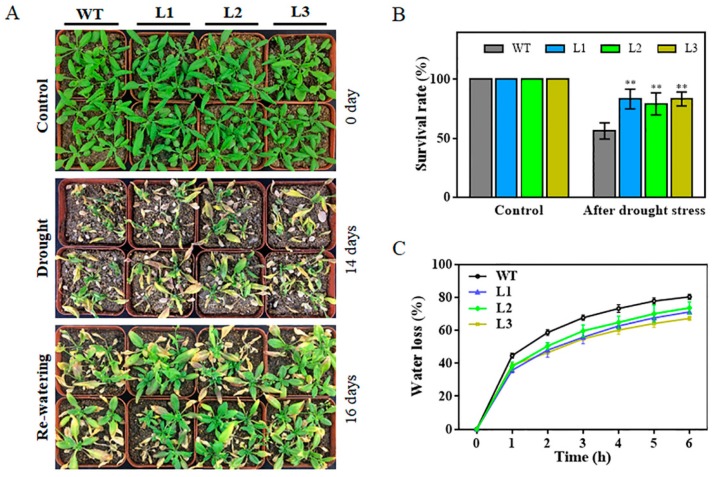
Figure 4.
Comparison of drought tolerance among WT and three TaHsfA6f overexpressing lines. (A) Drought-tolerant phenotypes and (B) survival rates of WT and transgenic lines. Water was withheld for 14 days; afterwards, re-watering was applied and survival rates were calculated two days after re-watering. (C) Water loss rates of WT and transgenic lines. The data presented are means ± SD of three replicates (** p < 0.01 by Student’s t-test).

