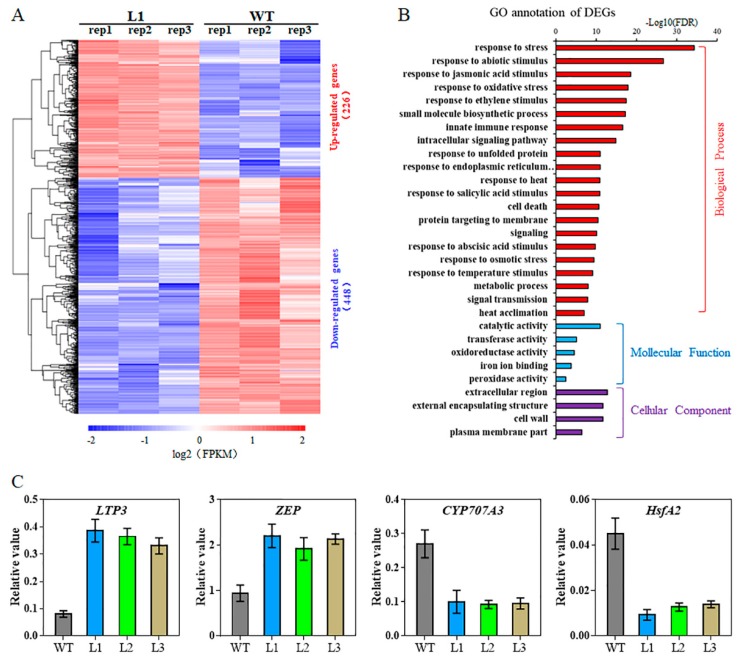
Figure 7.
Transcriptomic analyses of TaHsfA6f transgenic Arabidopsis. (A) Heat map of DEGs in leaves of transgenic vs. WT plants. The heat map represents the gene expression levels of 674 significant DEGs (log2Foldchange > 1 and FDR < 0.001) between transgenic (L1: rep1, rep2 and rep3) and WT (WT: rep1, rep2 and rep3) plants. The indicated scale is the log2 value of the normalized level of gene expression. (B) Gene ontology classification for DEGs in TaHsfA6f transgenic and WT plants. (C) qPCR validation of RNA-seq results for DEGs. Error bars indicate standard deviations.

