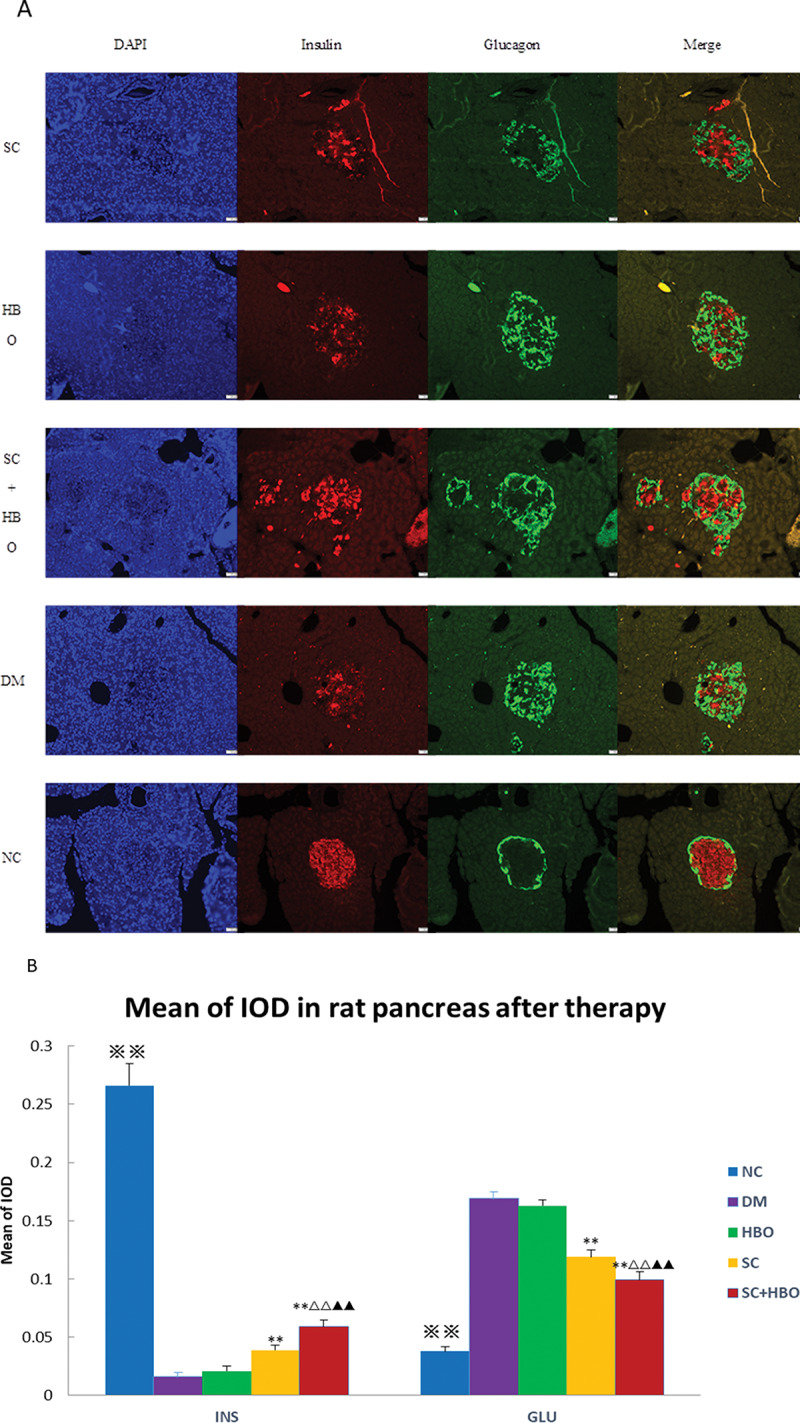
Figure 4. Immunofluorescence analysis after 6 weeks of therapy. A. Insulin/glucagon immunofluorescence staining for pancreatic islets: In the DM group, the distribution of glucagon-positive cells (green) in the islets was disorganized, and most cells were distributed in the center and around the islets; glucagon-positive cells increased and insulin-positive cells (4) decreased as compared with those in NC group. In SC+HBO and SC groups, glucagon-positive cells in the islet center decreased and insulin-positive cells increased as compared with DM group. Scale bar: 50 μm, 200×. B. MOD of insulin or glucagon immunohistochemistry in pancreatic islets: The MOD values of insulin for SC+HBO and SC groups were higher than those for DM group. The MOD value of SC+HBO group was higher than the values for SC and HBO groups; the MOD values of glucagon for SC+HBO and SC groups were lower than the value for DM group, while the MOD value of SC+HBO group was lower than the values reported for SC and HBO groups. **p<0.01 vs DM group; ▲▲p<0.01 vs SC group; △△p<0.01 vs HBO group. ⋇⋇p<0.01 vs each of the other four groups.