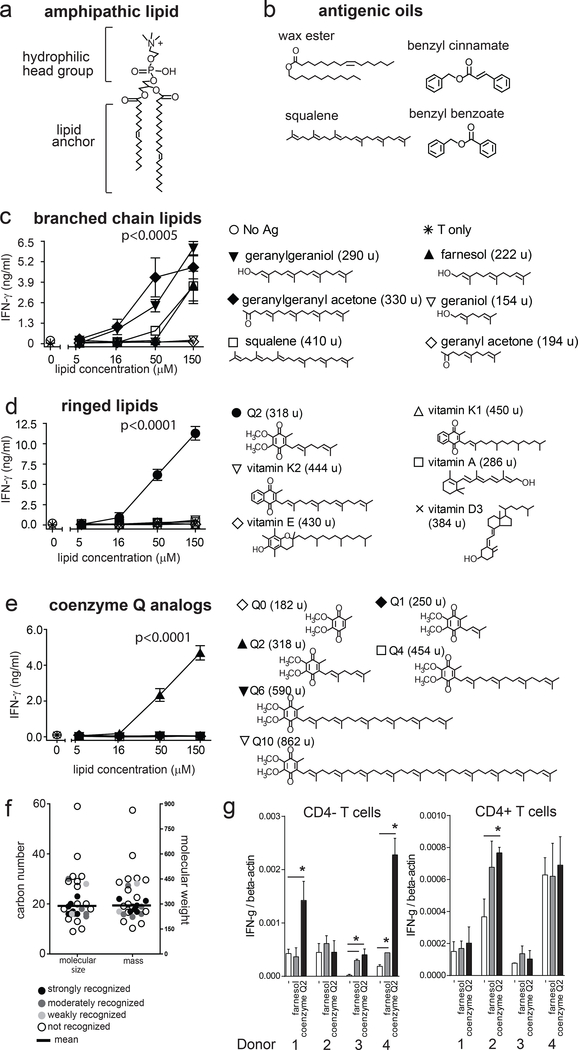
Figure 3. T cell responses to chemically diverse oily substances.
a. Using phosphatidylcholine as an example, CD1 ligands are often composed of head groups and lipid anchors, but (b) recently identified CD1a presented antigens are oils. c. BC2 T cells were tested for cytokine release in response to small hydrophobic molecules pulsed on plate-bound CD1a pre-treated with acidic citrate buffer to strip ligands (31). Tested compounds are classified into groups based on the presence of branched chain unsaturated lipids structurally related to squalene (c), ringed lipids structurally related to benzyl cinnamate (d) or molecules that show branched, polyunsaturated and ringed structure, such as coenzyme Q2 (e). Results of triplicate analyses are shown as mean +/− standard deviation with each compound tested 2 or more times. Post-hoc comparison by marginal means of the interaction term between lipid and concentration after adjustment by the Sidak method was used to group treatments by non-overlapping 95% confidence levels at the specified significance level following a significant result by two-way ANOVA. f. The size of all tested antigens is shown based on the number of carbon atoms (C) or mass (atomic mass units, abbreviated as u), as compared to the volume of the CD1a cleft, which has been measured at 1650 Å3, and can accommodate ~ 36 methylene units (C36) (19, 40). g. Purified T cells (CD4− and CD4+) were incubated overnight with plate-bound CD1a, either mock treated or pre-treated with the indicated antigens (50μg/ml). Real-time PCR of IFN-γ mRNA relative to β-actin.* P<0.05 Student’s t-test 2-sided, antigen-treated compared to mock-treated CD1a.

