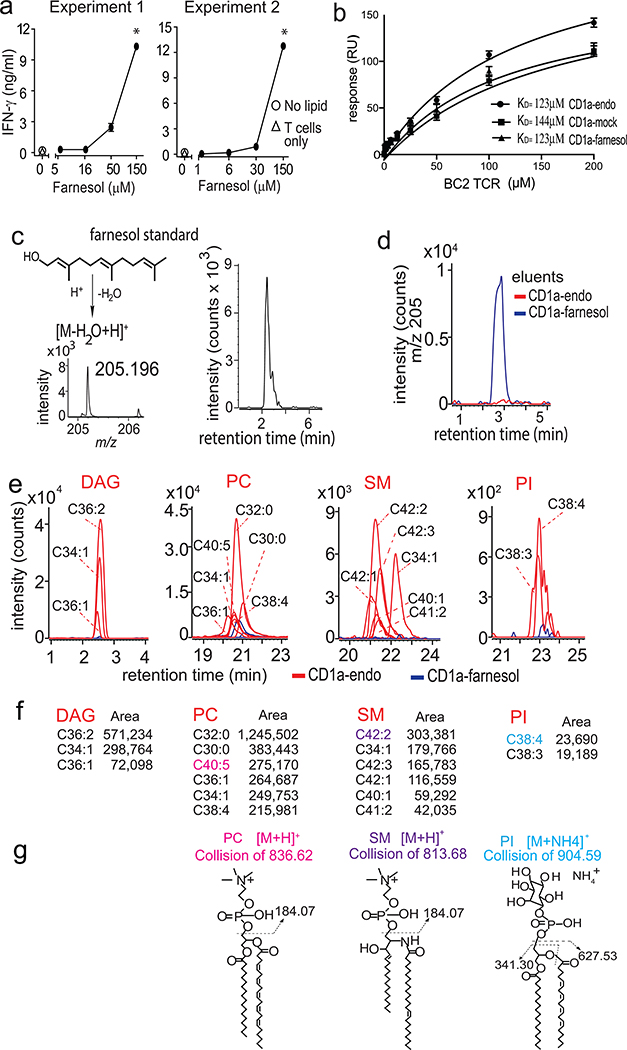
Figure 4. CD1a-farnesol complexes.
a. IFN-γ release by BC2 T cells in response to CD1a-coated plates treated with farnesol was measured. * The significance of lipid concentration on IFN-γ release was assessed by marginal means with adjustment by the Sidak method after a significant result by ANOVA, treating experiments 1 and 2 as blocks. At the highest concentration of farnesol in both experiments, non-overlapping 95% confidence intervals were observed at p < 0.001 b. Affinity measurements (KD) by surface plasmon resonance in response to the recombinant BC2 TCR binding biotinylated CD1a directly isolated from cells (CD1a-endo), CD1a pre-treated with farnesol (CD1a-farnesol) or CD1a treated with buffer (CD1a-mock). Positive mode HPLC-MS analysis of a farnesol standard (c) and eluents from farnesol-treated CD1a (d) demonstrated ions that matched the expected mass (m/z 205.195) of an indicated dehydration product with a retention time of 2.9 min. e-f. Lipid eluents from CD1a-endo and CD1a-farnesol were analyzed by positive normal phase HPLC-MS QToF mass spectrometry. Ion chromatograms were generated at the nominal mass values of diacylglycerol (DAG), phosphatidylcholine (PC), sphingomyelin (SM) and phosphatidylinositol (PI), which are shown as CX:Y, where X is the number of methylene units in the combined lipid chains and Y is the total number of unsaturations. g. Compound identifications were based on the unknown matching the retention time and mass of standards. Further, one compound in the PC, SM and PI families (shown in color) underwent collision-induced dissociation mass spectrometry analysis to generate the indicated diagnostic fragments.

