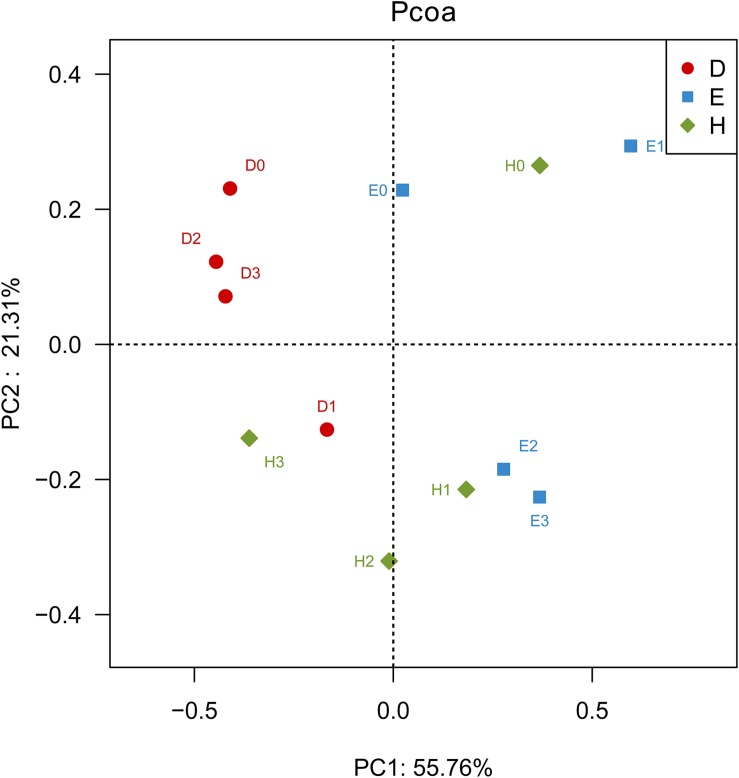
FIGURE 1.
Principal coordinate analysis (PCoA) based on the Bray–Curtis distance metrics of bacterial communities in the rhizosphere of soybeans with different nodulation phenotypes at different nitrogen levels (n = 36). D represents the rhizospheric soils of the line Dongfu 4; E represents the rhizospheric soils of the line En 1282; H represents the rhizospheric soils of the cultivar Heihe 38. Arabic numerals 0, 1, 2, and 3 represent the Nitrogen levels.

