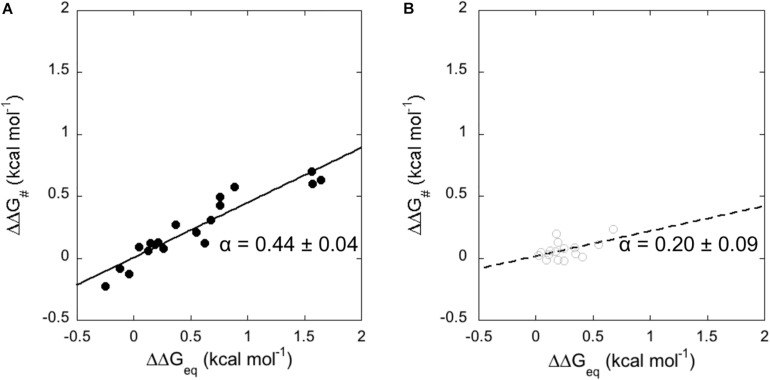
FIGURE 3.
Linear Free Energy Relationship plots (LFER) obtained from the analysis of kinetic data for the binding of N-SH2 domain with Gab2448–460 (A – black full circles and black line) and with Gab2448–460 M457A (B – gray empty circles and gray broken line). Lines represent the best fit to a linear equation.

