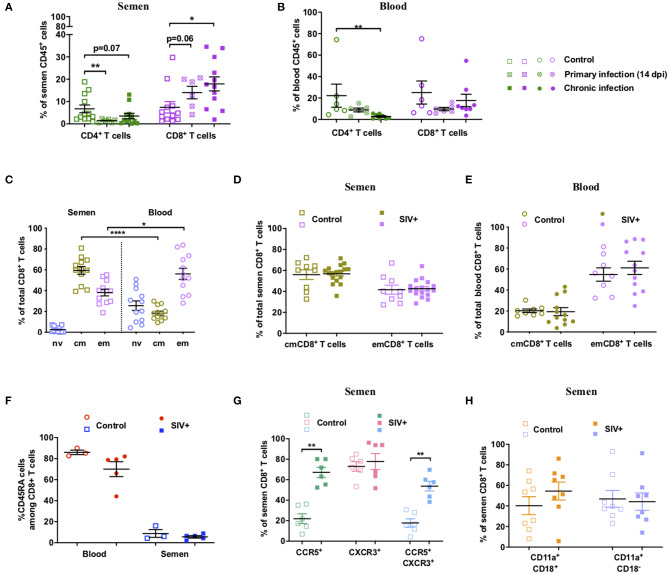
Figure 2.
Dynamics and phenotype of semen CD8+ T cells and comparison with blood. (A,B) Percentage of CD4+ and CD8+ T cells of total CD45+ cells in semen (A) and peripheral blood (B) in uninfected (n = 12 or 6) and SIV+ macaques at 14 dpi (n = 6) and at the chronic stage (> 1 year pi, n = 12 or 8). The mean and SEM is shown. (C) Percentage of Tnv (orchid), Tcm (green) and Tem (lavender) CD8+ T cells in blood (round dots) and semen (squared dots) of 12 uninfected macaques for which paired blood and semen samples were available. (D,E) Percentage of each CD8+ T cell subset in the semen (D) and blood (E) of SIV− (open symbols, n = 9 or 8) and chronic SIV+ macaques (filled symbols, n = 17 or 12). Different control animals were used in panels (C–E). (F) CD45RA expression of semen CD8+ T cells: percentage of CD45RA+CD8+ T cells in the blood (red circles) and semen (blue squares) of SIV− (open symbols, n = 3) and SIV+ (filled symbols, n = 5) macaques is shown. (G) CCR5 and CXCR3 expression on semen CD8+ T cells. Percentage of CCR5+ (green squares), CXCR3+ (rose squares), and CCR5+ CXCR3+ (blue squares) cells in SIV− (open squares, n = 6) and SIV+ (filled squares, n = 6) macaques. (H) LFA-1 integrin (CD11a+CD18+) expression on semen CD8+ T cells. % of LFA-1+ (orange squares) and CD11a+CD18− cells (violet squares) in SIV− (open squares, n = 8) and SIV+ (filled squares, n = 8) macaques. The mean and SEM are shown. *indicates significant differences between groups (Mann-Whitney test, *p < 0.05, **p < 0.01, and ****p < 0.0001).

