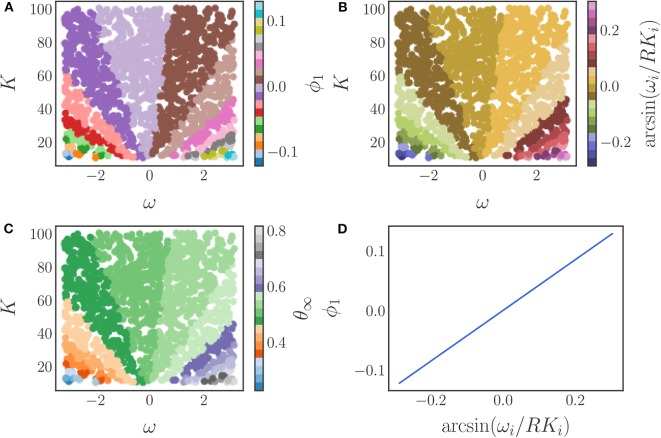
Figure 11.
(A) The parameter space (ω, K) colored by the diffusion map coordinate ϕ1. (B) The parameter space (ω, K) colored by the analytical parameter (24). (C) The parameter space (ω, K) colored by the steady state phase θ∞. (D) A comparison between the data-driven parameter and the analytically derived effective parameter. The one-to-one mapping between the two verifies their equivalence.

