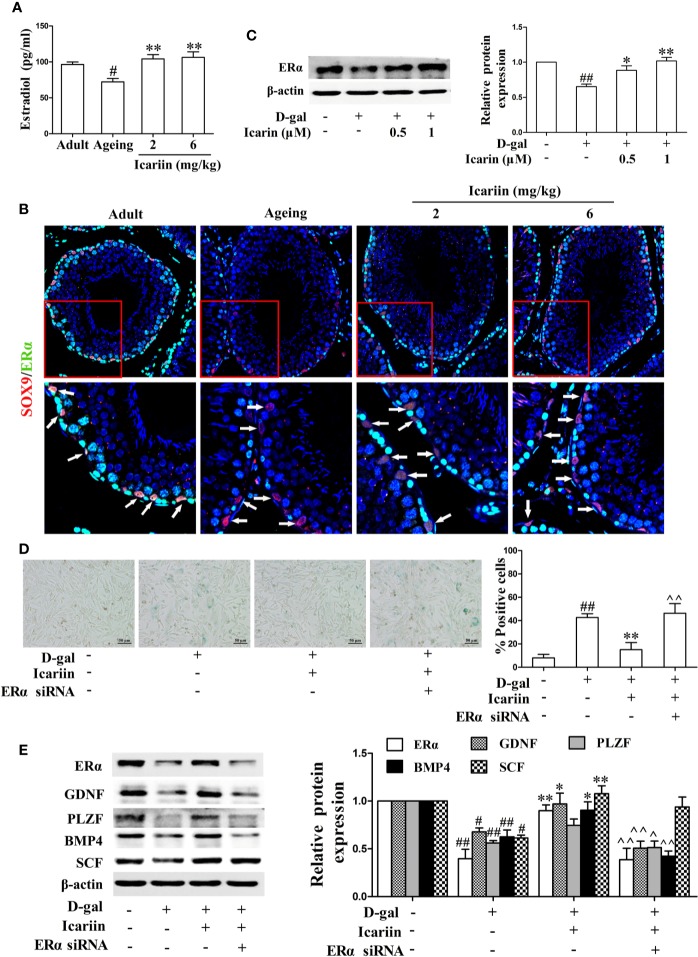
Figure 4.
Icariin alleviates Sertoli cell injury via ERα signaling. (A) Testicular estradiol concentrations were measured using ELISA kits. Each value represents the mean ± SEM with 5–6 rats per group. #P < 0.05, versus adult control group; **P < 0.01 versus aging model group. (B) Co-localization of Alexa Fluor 488-labeled ERα (green) with Alexa Fluro 594-labeled SOX9 (red) in the testis was detected with a Nikon A1R+ confocal microscope. Upper panels indicate one intact seminiferous tubule (original magnification, 400×). Lower panels correspond to magnified boxed areas (original magnification, 800×). White arrows indicate colocalization of ERα and SOX9 in Sertoli cells. These photomicrographs are representative of three independent experiments. (C) The relative protein expression levels of ERα in D-gal-stimulated TM4 cells were measured by western blotting. TM4 cells at 5 × 10⁵/well in 6-well plates were pretreated with or without icariin (0.5–1 μM) or DMSO (0.1%) for 20 h, and then incubated with 100 mM D-gal for 60 h. All values are expressed as means ± SEM of three independent experiments. (D, E) TM4 cells at 1 × 10⁶/well in 6-well plates transferred with or without ERα siRNA were incubated with icariin (1 μM) or DMSO (0.1%) for 20 h, followed by treatment with 100 mM D-gal for 60 h. (D) Representative images of SA-β-gal staining of cells (left; scale bar = 50 μm), and the percentages of SA-β-gal-positive cells from a total of 500 cells (right). (E) The relative protein expression levels of ERα, GDNF, PLZF, BMP4, and SCF in TM4 cells were measured by western blotting analysis. All values are expressed as means ± SEM of three independent experiments. #P < 0.05, ##P < 0.01 versus control; *P < 0.05, **P < 0.01 versus D-gal-stimulated group; ^P < 0.05, ^^P < 0.01 versus icariin-treated group.

