
FIGURE 1.
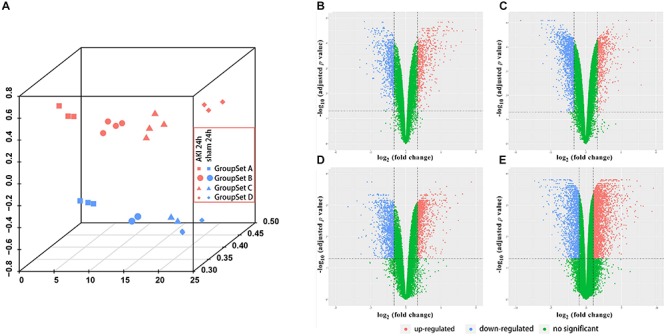
Principle component analysis (PCA) plot and differential expression data between AKI 24 h and sham 24 h groups in all four GroupSets. (A) PCA plot shows the tight clustering of biological replicates and distinct clustering between AKI 24 h and sham 24 h conditions in all four GroupSets. Differential expression data between AKI 24 h and sham 24 h groups in (B) GroupSet A data, (C) GroupSet B data, (D) GroupSet C data, and (E) GroupSet D data. The criteria for statistically significant difference of DEGs was adjusted p < 0.05 and |log2 fold change (FC)| ≥ 1 in expression.