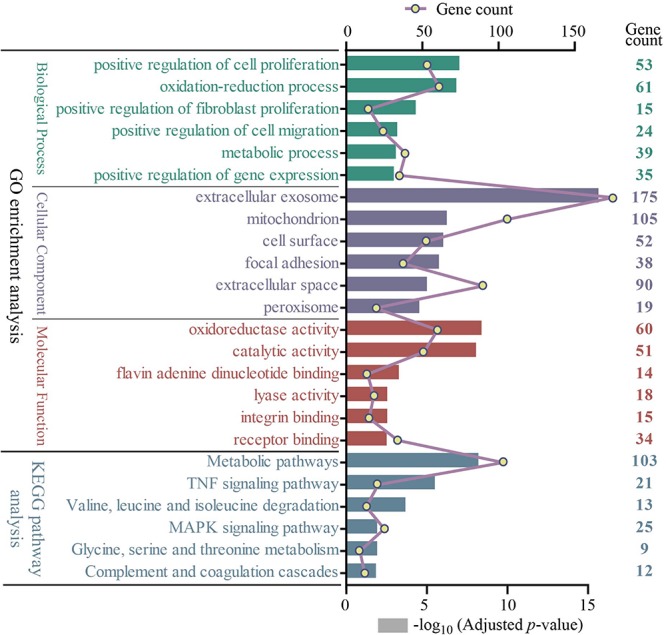
FIGURE 3.

The GO and KEGG pathway enrichment analysis of 722 overlapping DEGs (top 6 were listed). Four different colors separately represent four different categories: biological process, cellular component, molecular function, and KEGG pathway. The rectangle represents−log10 (adjusted p-value); the line and point represent gene count. GO, Gene Ontology; KEGG, Kyoto Encyclopedia of Genes and Genomes.
