FIGURE 4.

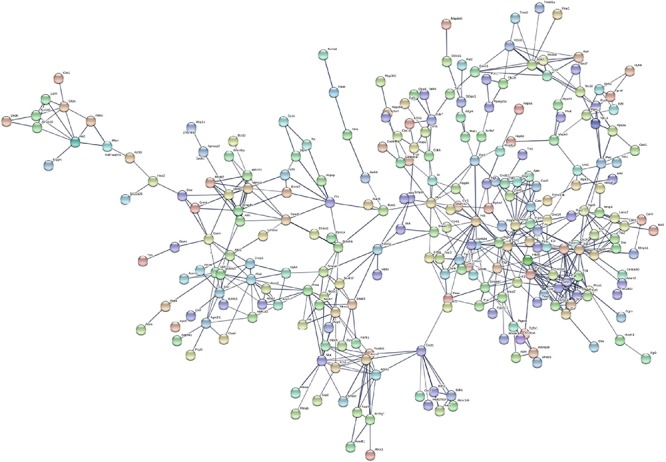
Protein–protein interaction network of the 722 overlapping DEGs with a score >0.7. Disconnected nodes were hiding in the network. Each node stands for a gene or a protein, and edges represent the interactions between the nodes.

Protein–protein interaction network of the 722 overlapping DEGs with a score >0.7. Disconnected nodes were hiding in the network. Each node stands for a gene or a protein, and edges represent the interactions between the nodes.