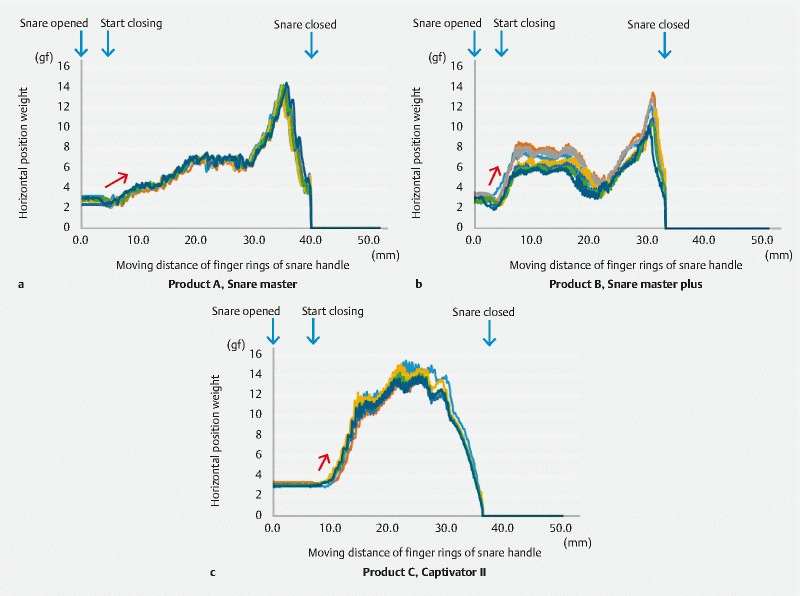
Fig. 2 .

Representative data measured by our system . Dynamic performance of each snare was measured seven times and is shown as a line graph. Red arrows are gradients. a Line graph of product A (oval standard snare). b Line graph of product B (hexagonal standard snare). c Line graph of product C (round hard snare). Notes: “Snare opened” was defined as the snare being fully opened, and the opening movement of the handle was complete. “Start closing” was defined as the point when the fully opened snare started closing. “Snare closed” was defined as the snare being fully closed, and the closing movement of the handle was complete.
