
Figure 1:
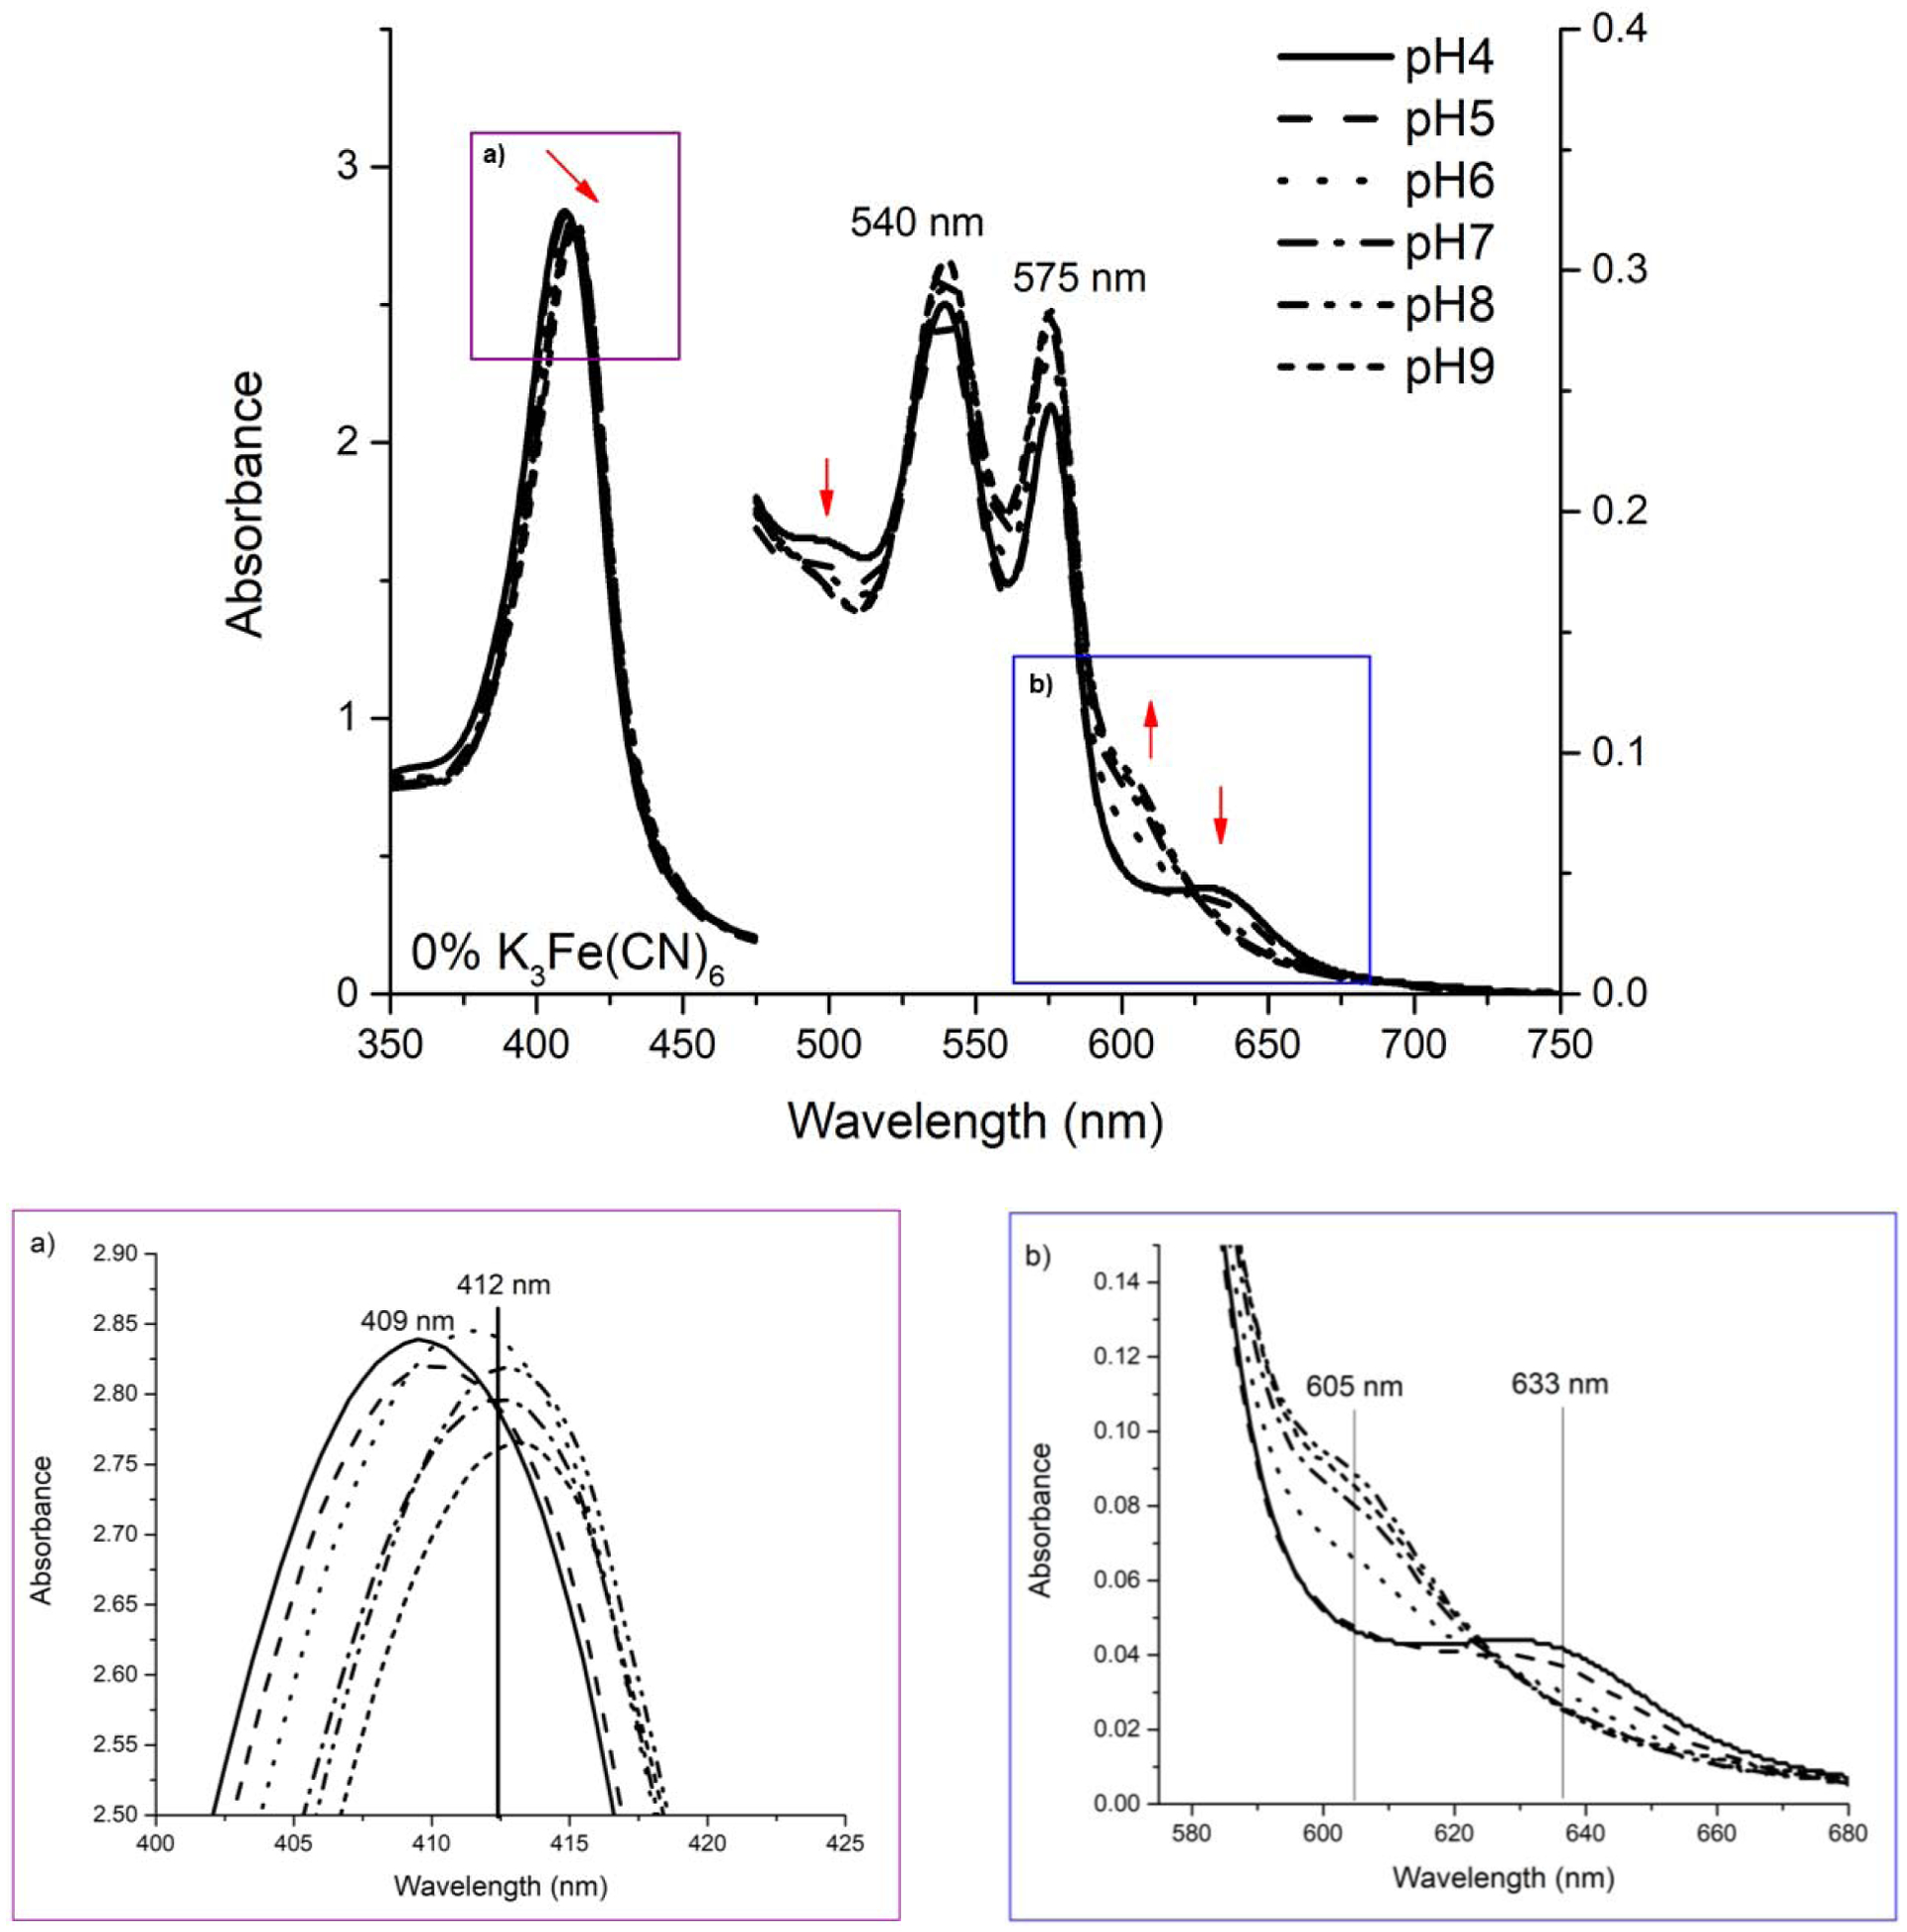
Visible region spectra of the (HbI-HbIII)-O2 complex when transferred to acid and alkaline PBS. Inserts a and b are present to facilitate the changes visualization. Arrows show band shifts going from acid to alkaline environment. The oxy Q bands shift, from pH 4 to around pH 5, forming two new bands at 503 and 633 nm, while the Soret band shifts to 409 nm, towards the 403 nm met-aquo band. At near neutral pH, the oxy complex bands at 540 and 576 nm dominate the Q region and the Soret band at 412 nm. At alkaline pH, the characteristic band of Fe-Tyr appears at ~605 nm.