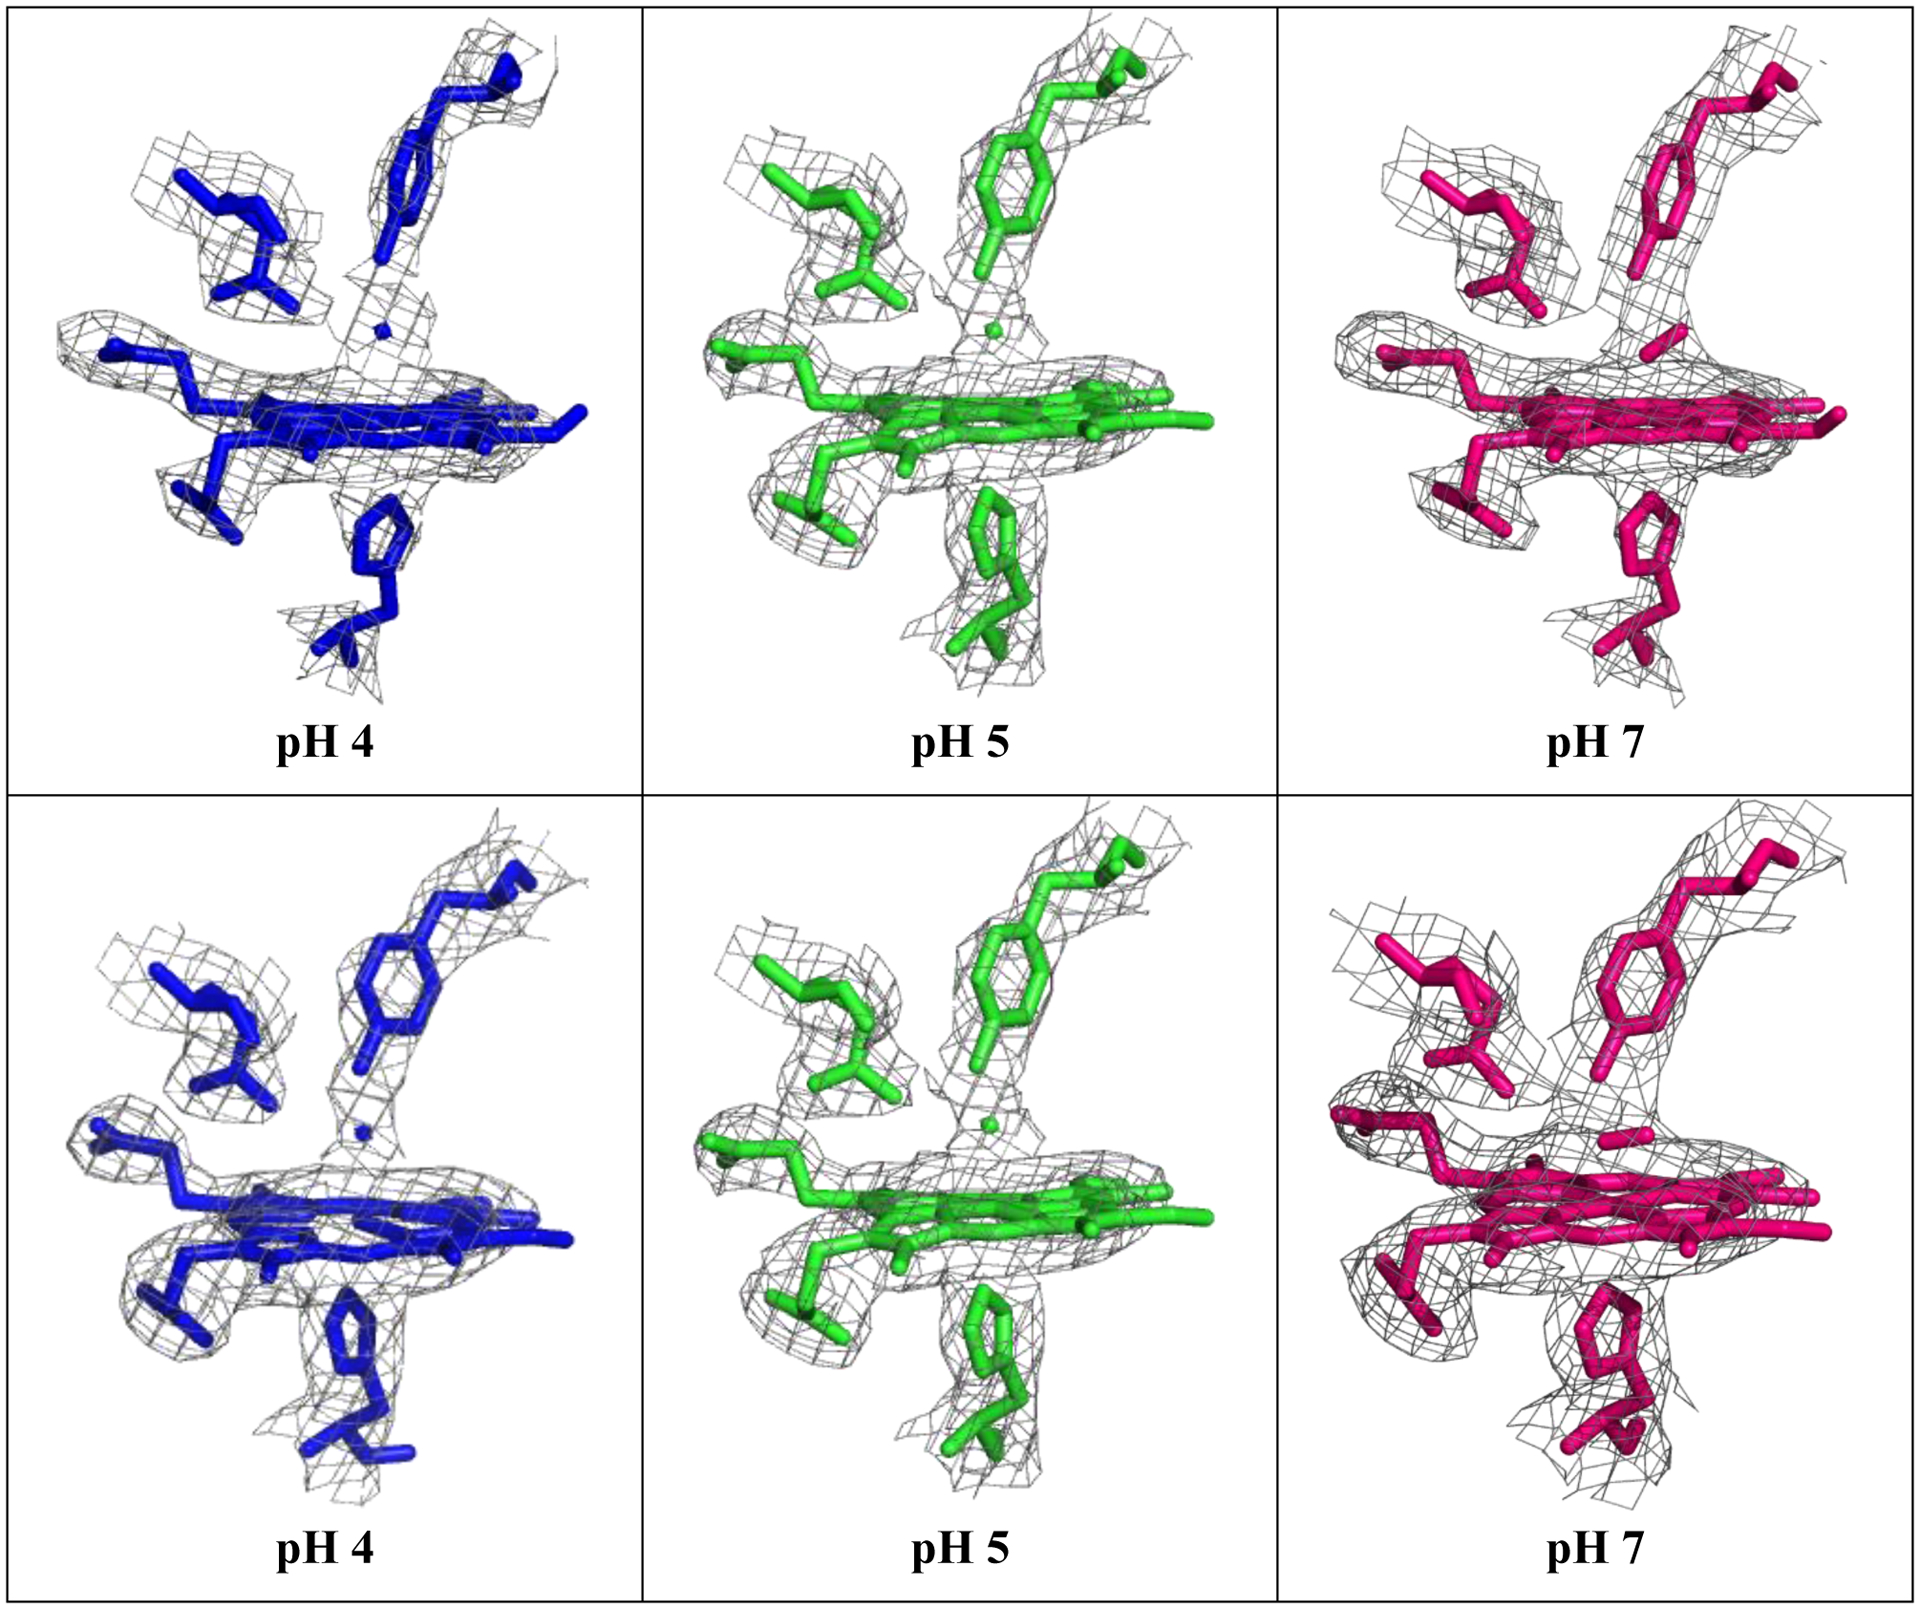
Figure 4:

Electron density map of the heme pocket of L. pectinata (HbII-HbIII)-O2 at pH 4(blue), pH 5 (green), and pH 7(pink), chain A (top) and chain B(bottom). The 2Fo-Fc contours for the images presented here are 1σ within 2 Å of the selected atoms.
