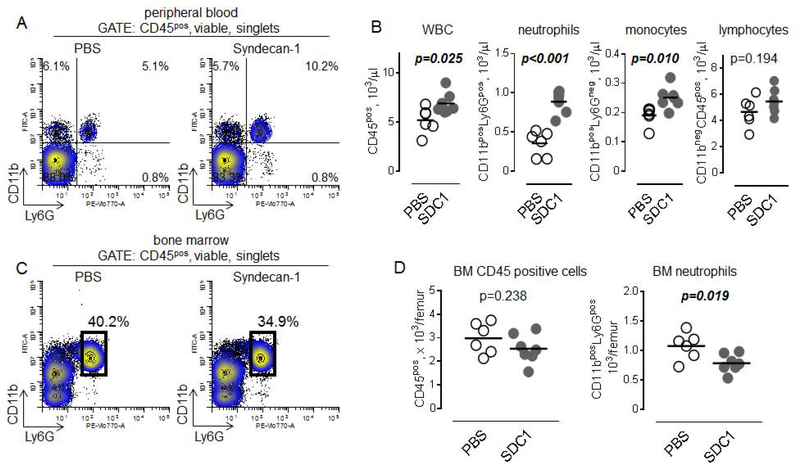
Figure 4. Syndecan-1 induces mobilization of murine bone marrow myeloid cells.
A. Flow cytometry plots showing percentage of CD11bposLy6Gpos circulating neutrophils (upper right quadrant), CD11bposLy6Gneg monocytes (upper left quadrant) and lymphocytes (lower left quadrant) 6 hours later after injection of PBS (control, left) or 120 μg/kg human recombinant syndecan-1 (right). B. Graphical representation of data from flow cytometry showing number of (left to right): WBC, neutrophils, monocytes, and lymphocytes after administration of PBS (n=6) or syndecan-1 (SDC1, n=7). Unpaired t test. C. Flow cytometry plots showing percentage of CD11bposLy6Gpos neutrophils (black gate) in bone marrow 6 hours later after injection of PBS (control, left) or 120 μg/kg human recombinant syndecan-1 (right). D. Number of CD45pos cells (left) and neutrophils (right) in murine bone marrow after administration of PBS (n=6) or syndecan-1 (SDC1, n=7). Unpaired t test.

