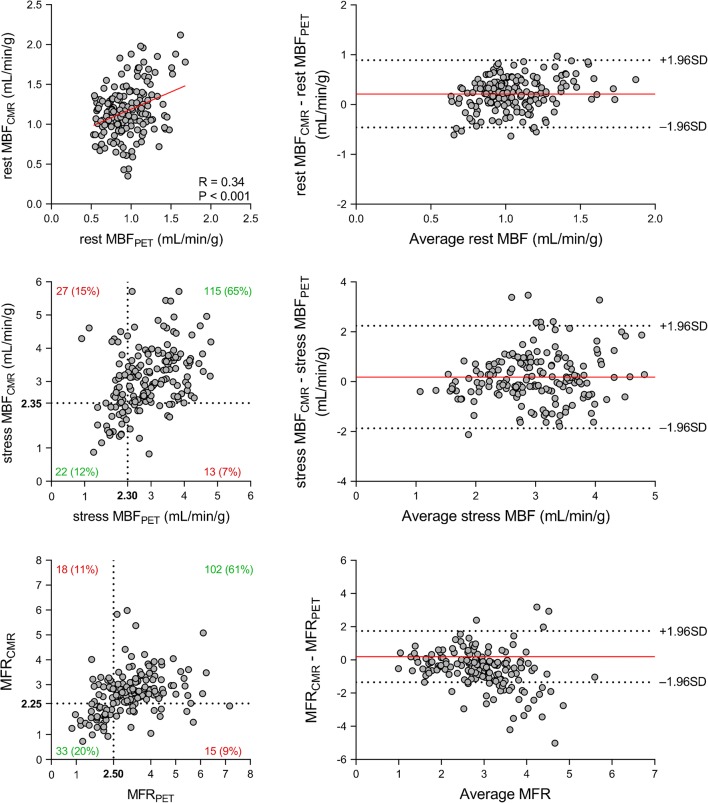
Fig. 3.
Regional perfusion. Scatter (left) and Bland-Altman (right) plots comparing CMR and [15O]H2O PET measurements of rest MBF (top) and stress MBF (middle) and MFR (bottom) on a per-vessel basis. In the scatter plots of stress MBF and MFR, the dashed black lines indicate the thresholds for abnormal myocardial perfusion. Stress MBF and MFR correlate significantly between CMR and [15O]H2O PET (r = 0.39; P < 0.001 for stress MBF and r = 0.36; P < 0.001 for MFR). In the Bland-Altman plots, the solid red line indicates the mean bias, and the dashed black lines indicate the limits of agreement. Abbreviations as in Fig. 1

