Fig. 4.
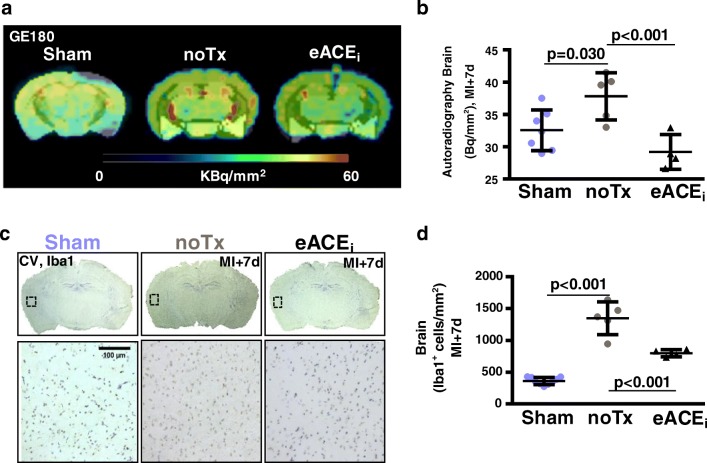
Correlative measurements of brain TSPO signal. a In vitro autoradiography brain sections and b quantitative analysis show elevated activity concentration at 7 days post-MI, attenuated by enalapril. c Corresponding Iba1 immunostaining identifies microglia in the cerebral cortex. d Quantification illustrates elevated Iba1 staining after MI which responds to early enalapril therapy. Counterstaining by cresyl violet (CV). noTx, untreated; eACEi, early enalapril treatment

