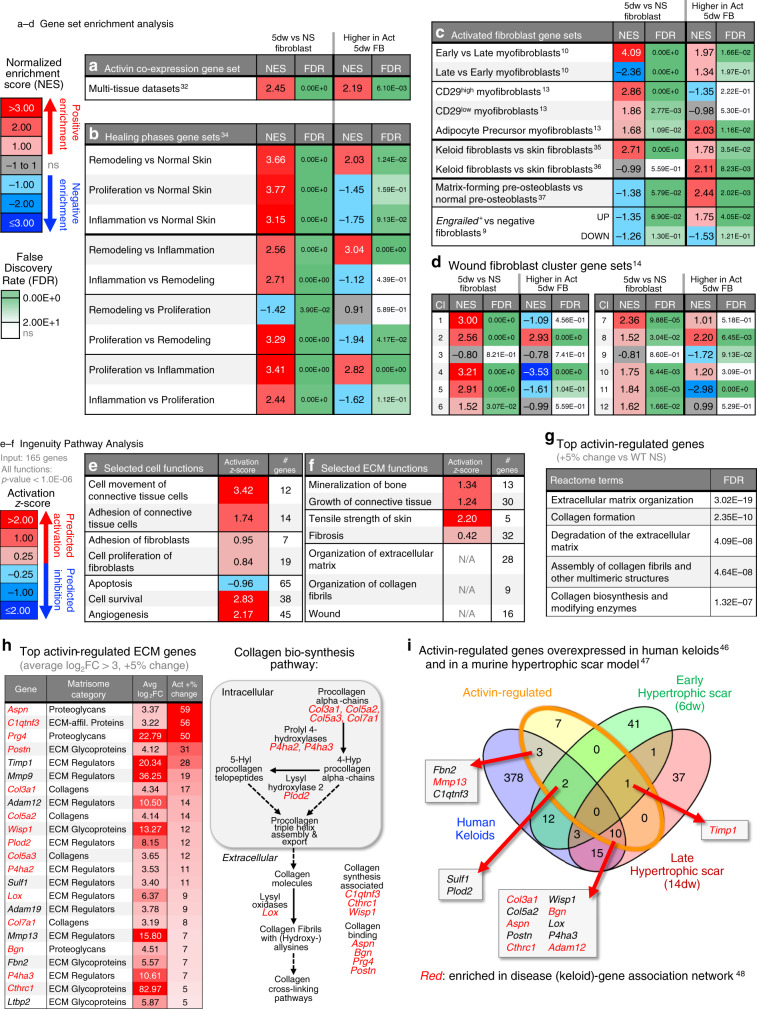
Fig. 3. Activin induces a pro-fibrotic gene expression signature in fibroblasts.
a–d Genes regulated in 5dw vs NS fibroblasts and pre-ranked list of genes relatively up-regulated in Act 5dw/WT NS vs WT 5dw/WT NS (see Supplementary Fig. 3a, b) were subjected to GSEA against custom gene sets. NES and FDR values are shown. FDR are color-coded based on statistical significance (green). a Activin co-expression gene set derived from the SEEK database of multi-tissue gene expression datasets32. b Healing phase gene sets derived from microarray data of small excisional mouse wounds at different healing time points34. c Activated fibroblast gene sets include genes up-regulated in: (i) ɑ-SMA-positive myofibroblasts from 12- or 26-day large excisional wounds10; (ii) CD29high, CD29low, or adipocyte precursor myofibroblasts from 5-day small excisional wounds13; (iii) human keloid vs normal skin fibroblasts35,36; (iv) matrix-forming vs normal pre-osteoblasts37; and genes up- or down-regulated in scar-forming engrailed+ vs engrailed− fibroblasts9. d Twelve wound fibroblast cluster gene sets identified by single-cell RNA sequencing of fibroblasts from 12-day large excisional wounds14. e, f Genes relatively up-regulated in 5dw of Act mice were subjected to IPA. Selected annotated cell functions (e) and ECM functions (f) were extracted and are shown with respective activation Z-scores and numbers of input genes enriched in the respective functions (# genes). P value < 1.0E-06 for all shown functions. g Top activin-regulated genes (at least 5% change vs WT NS) were subjected to functional enrichment analysis using enrichR, and the top five Reactome terms are shown with respective FDR values. h Top activin-regulated genes (more than 5% change vs WT) were filtered by the Matrisome database. Left: Top up-regulated (in 5dw vs NS, log2FC > 3, FDR < 0.05) ECM genes are shown with respective Matrisome category, average log2FC (5dw vs NS), and the relative increase in upregulation in Act vs WT 5dw fibroblasts (Act +% change). Numerical values are color coded based on magnitude (red background). Right: Genes in red are associated with the collagen biosynthesis pathway. i Venn diagram comparison of activin-regulated ECM genes (orange oval) and genes significantly overexpressed in keloids46 (blue oval) and in a murine hypertrophic scar model (6-day wound, green oval; 14-day wound, red oval47), with additional enrichment in the keloid gene association network48, red text). Source data are provided as a Source Data file (Fig. 3).

