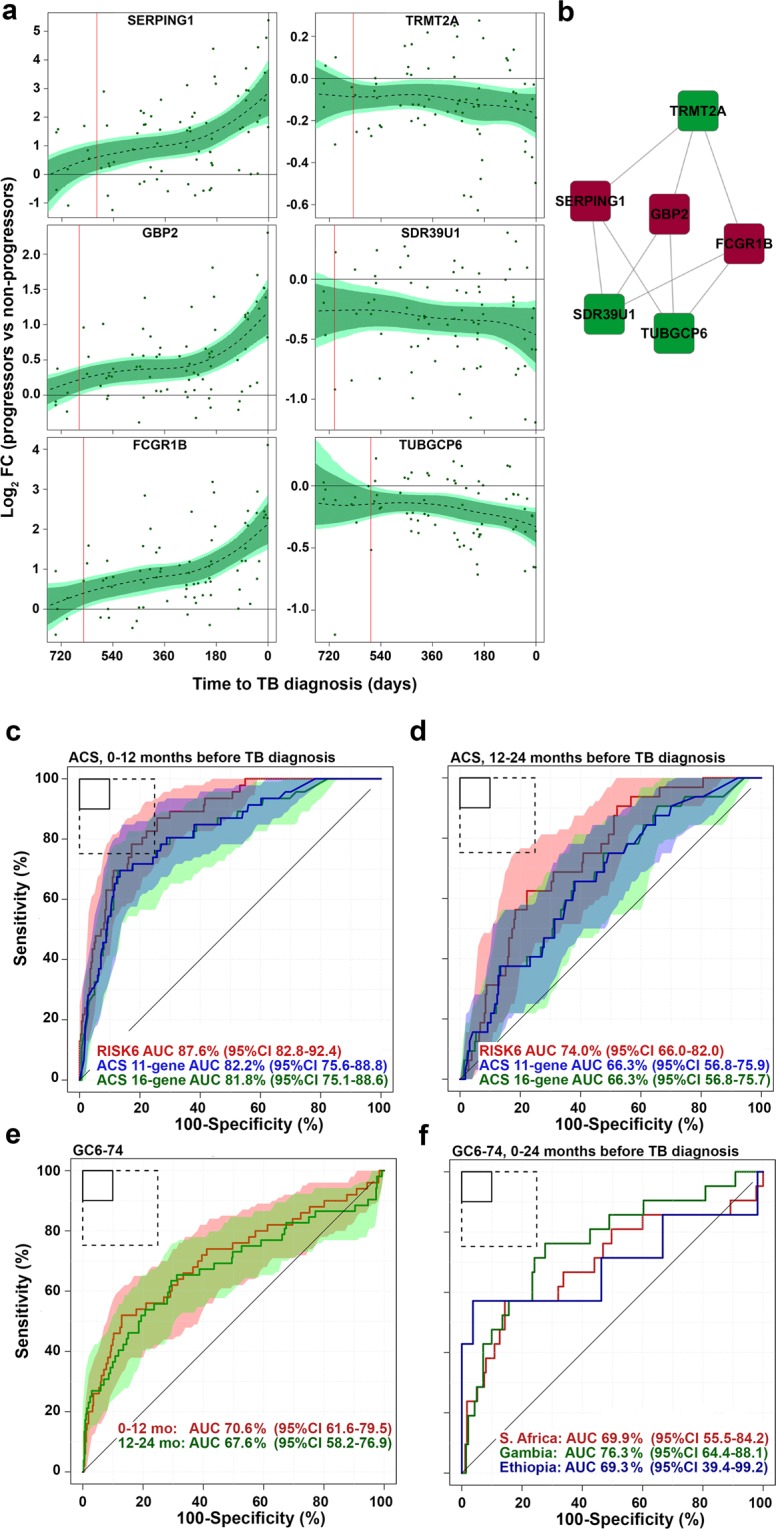
Figure 1.

Discovery of the RISK6 signature. (a) Expression kinetics of the six transcripts in RISK6 signature over time, measured by RNA-sequencing and expressed as log2 fold change between matched adolescent progressors and controls and modelled as non-linear splines (dotted lines). Light green shading represents 95% CI for the temporal trends, computed by performing 2000 spline fitting iterations after bootstrap resampling from the full dataset. Transcripts that are upregulated during TB progression are on the left and those that are downregulated on the right. (b) RISK6 comprises nine pairs that each link a transcript that is upregulated during TB progression with one that is downregulated, relative to healthy controls. Lines indicate pairing (refer to Table 1 for TaqMan primer-probe sets that match the transcripts). Transcripts that are upregulated in progressors are in red nodes and those that are downregulated in progressors are in green. (c and d) Receiver operating characteristic (ROC) curves depicting the performance (model fit) of RISK6, relative to the ACS 11-gene7 and ACS 16-gene6 signatures, measured by qRT-PCR on RNA from whole blood samples collected from participants of the ACS cohort within one year of TB disease diagnosis (c), or 1–2 years before TB diagnosis (d). Shaded areas depict the 95% CI. (e) Receiver operating characteristic (ROC) curves depicting prognostic performance, by blind prediction of RISK6, measured by qRT-PCR on RNA from whole blood RNA collected from participants of the GC6-74 cohort of household contacts. Shaded areas depict the 95% CI. (f) Prognostic performance of RISK6 for incident TB in household contacts from South Africa, The Gambia or Ethiopia, measured by qRT-PCR on RNA from whole blood RNA collected within 1 year of TB diagnosis from participants of the GC6-74 cohort. The boxes in the top left corner represent the optimal (solid line) and minimum (dotted line) criteria set out in the target product profile for an incipient TB test. Performance on 0–2 years before TB diagnosis is shown in Table 1.
