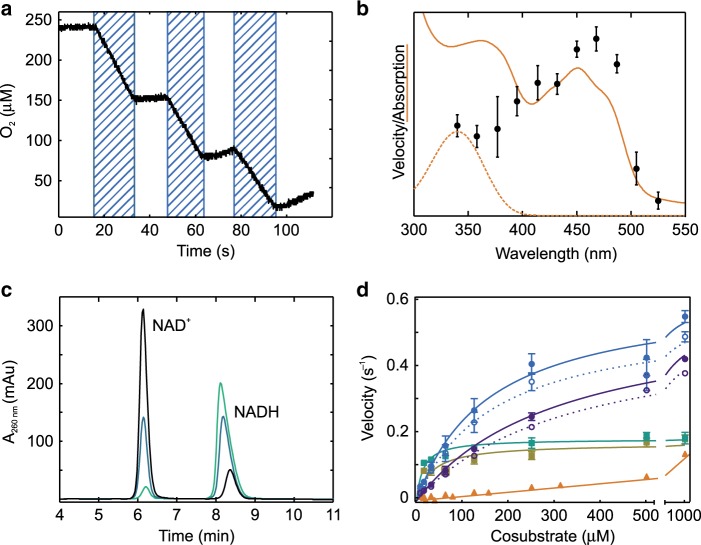
Fig. 2. Characteristics of PqsL photoreactivity.
a PqsL photoreduction measured over several cycles of illumination (shaded intervals). The reaction of 10 µM PqsL was monitored by O2 consumption, 1.25 mM NADPH was used as electron donor (one representative experiment shown). b Apparent velocity as a function of the wavelength of the illuminating light (black dots) together with the UV/Vis spectra of PqsL (orange, solid line) and NADH (orange, dashed line). c NAD+ formation from NADH oxidation by PqsL after 1 min (light green), 5 min (petrol blue) and 10 min (black) of illumination, as monitored by HPLC (one representative experiment). d Kinetics of light-induced oxygen consumption by PqsL supplemented with NADPH (blue circles), NADH (violet circles), NADPH + 2-ABA (green squares) and NADH + 2-ABA (ocher squares) or free FAD + NADPH (orange triangles). Rates of the PqsL reactions were corrected for the contribution of residual free FAD (calculated from KD of the PqsL–FAD complex) and FAD photodegradation. Dashed lines/open circles show the rates of FAD-saturated PqsL prior to any corrections (i.e. rates as measured, normalized to FAD content). Line fits were calculated according to a Michaelis-Menten model. Parameters are provided in Supplementary Table 1. Experimental data on photoreduction of PqsL and free FAD with various alternative electron donors are provided in Supplementary Figs. 2 and 3. Error bars indicate SD of three identical measurements (panels b, d).

