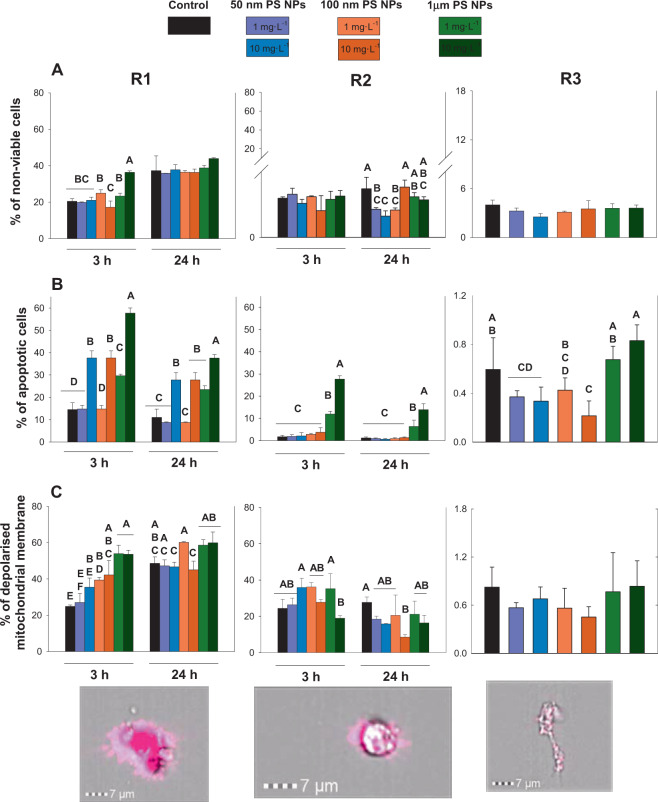
Figure 2.
Toxicological responses (non-viable cells, apoptotic cells and depolarised mitochondrial membrane; panels A, B and C respectively) measured at 3 and 24 h when R1, R2 and R3 were exposed to 1 and 10 mg·L−1 of 50 nm, 100 nm and 1 µm PS NPs. Different uppercases represent significant differences (p < 0.05; Bomberroni’s post hoc test; n:3) among the treatments and concentrations tested. No significant differences between times by Repeated Measured GLM analysis are shown as a single graph (mean ± SD between both times). Amnis imaging flow cytometers are shown.

