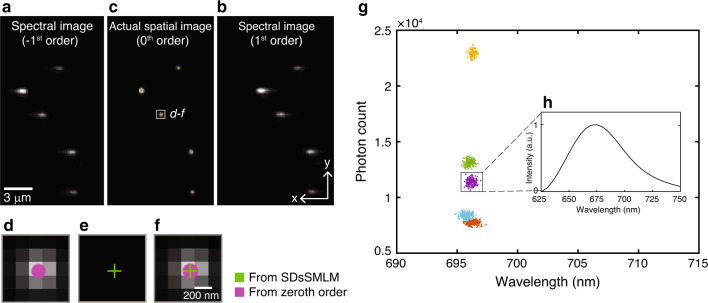
Fig. 2. Single-color SDsSMLM imaging of nanospheres.
a–c First frame of the simultaneously captured spectral images and actual spatial image of nanospheres, corresponding to the −1st, 1st, and 0th orders, respectively; d, e Magnified views to compare the actual and virtual spatial images of the region highlighted by the white box in panel c; f Corresponding overlaid image; g Scatter plot of the photon count versus the spectral centroid; h Averaged spectrum of one nanosphere from 200 frames, corresponding to the purple cluster in panel g.

