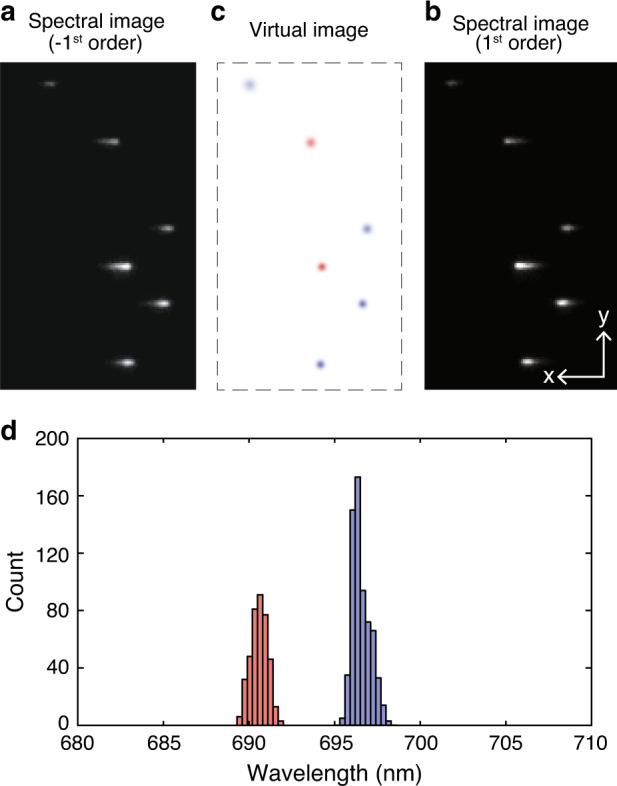
Fig. 3. Multi-color SDsSMLM imaging of nanospheres.

a and b First frame of the simultaneously captured spectral images of nanospheres from the −1st and 1st spectral channels, respectively; c Calculated virtual spatial image of the nanospheres; d Spectral centroid distribution of individual nanospheres. The red and blue colours in panel c correspond to the spectral centroids of 690.6 and 696.5nm, respectively, with spectral precisions of 0.48 and 0.53nm.
