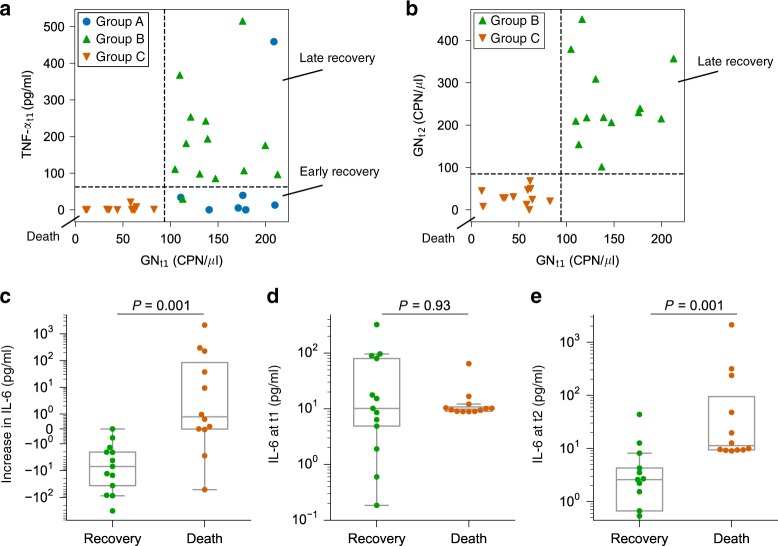
Fig. 5. Accurate classification of septic shock patient outcomes.
a Decision-tree classification shows that the patients can be classified with excellent accuracy using GN bacteria load and TNF-α level at time point t1 (the dashed lines represent the decision-making thresholds). b The level of GN bacteria at time points t1 and t2 in groups B and C also showed distinct separation thresholds (dashed lines). c–e Temporal changes of IL-6 (c), and the IL-6 levels at time point t1 (d) and time point t2 (e) of the patients who recovered (group B) (n = 13) or died (group C) (n = 12) from septic shock. In (a), the classification accuracies for groups A (n = 7), B (n = 13), and C (n = 12) are 85.71%, 92.31%, and 100%, respectively. Note that the scale of the y axis in (c) is symmetric and logarithmic. (c–e) Two-sided Mann–Whitney U test with Benjamini–Hochberg correction.

