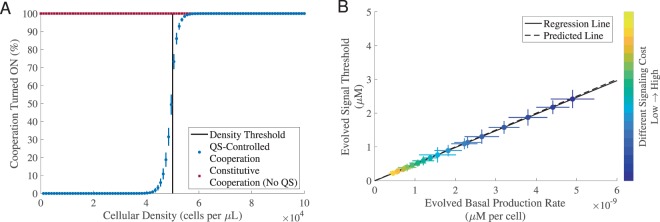
Figure 1.
Signal production rate and threshold response co-evolve in a quorum sensing co-ordination game. We evolved 5,000 initially identical genotypes for 5,000 generations in a patchy, variable density environment (see Methods Summary and Supplemental Material for more details). In all simulations, the population was clonal, i.e., G = 1, the cost of cooperation was fixed and there was no auto-regulation. (A) We used a fixed cost of signaling, and recorded the percentage of evolved individuals who turned on cooperation in 100 testing environments where the cellular density varied from 101.5 to 105 cells per μL. Note constitutive individuals, by definition, will always turn on cooperation in all environments as shown by the red dots. The vertical black line indicates the pre-set density threshold NTh, i.e., the median cellular density across 100 testing environments (5.0016 × 10⁴ cells per μL). (B) Varying the cost of signaling (Csig ∈ [5 × 10⁸, 100 × 108]; step size: 5 × 10⁸) predictably impacts the balance of signal production and response. Each dot represents the evolved mean results (averaged over the last 50 generations). The color-bars indicate different values of Csig from low signaling cost (dark blue) to high singling cost (bright yellow). The solid black line is the regression line fitted using the generalized linear model with a normal distribution: R2 = 1, F-test, p = 5.511 × 10−50. The dashed black line is the predicted line calculated by STh = pNTh/u, where u = 10−4 μL/s. The horizontal and vertical error bars represent the standard deviation over 30 replications. The remaining parameters used in the simulations can be found in Supplemental Material, Table S1. Note that given the computational complexity, in most cases, we only evolved the population for 5,000 generations. Evolving for a longer time will not change the results qualitatively. An example of evolution trajectories from (B) can be found in Supplemental Material, Fig. S1.

