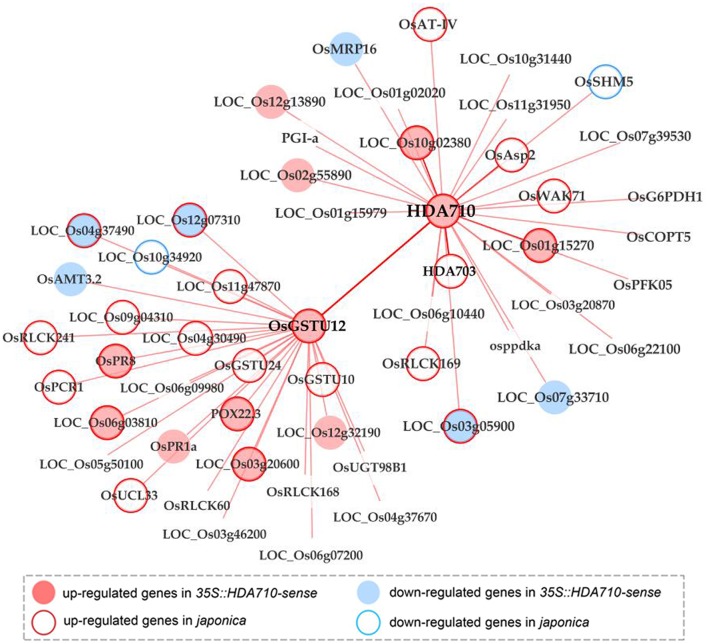
Figure 5.
Co-expression network of HDA710 combined with transcriptome data reveals a close link with OsGSTU12. The network is constructed from RiceFREND using Cytoscape software. Nodes in light pink represent genes up-regulated in 35S::HDA710-sense vs. 35S::HDA710-antisense, while nodes in light blue represent genes down-regulated in 35S::HDA710-sense vs. 35S::HDA710-antisense. Nodes with light pink borders represent genes up-regulated in japonica Nipponbare vs. indica 9311, while nodes with light blue borders represent genes down-regulated in japonica Nipponbare vs. indica 9311. Lines between nodes represent positive co-expression relationships.

