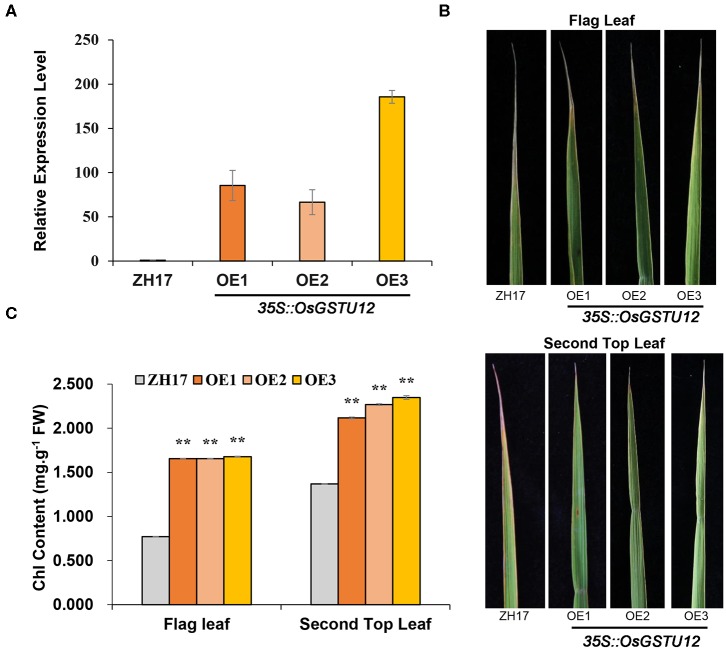
Figure 6.
Comparative analysis of transgenic lines over-expressing OsGSTU12 with controls at the late developmental growth stage in the field. (A) Relative expression levels of OsGSTU12 in the wild type (ZH17) and OsGSTU12 over-expression transgenic lines (OE1, OE2, OE3). Data are means ± SD (n = 3). (B) Flag leaf and second top leaf in wild-type and over-expression lines. (C) Chlorophyll content of flag leaf and second top leaf from top. Data are means ± SD (n = 4). **P < 0.01; Student's t-test.

