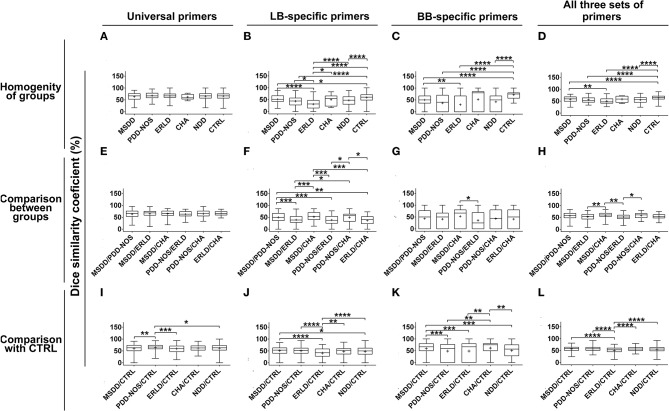
Figure 2.
Box-plot diagram based on Dice similarity coefficient. Homogeneities of the groups and similarities between the groups were evaluated by Dice similarity coefficient (%). Homogeneities of the groups were evaluated by comparing DGGE profiles obtained by universal, Lactobacillus (LB)-, Bifidobacteria (BB)-specific primers and all three sets of primers together (A–D) within Control (CTRL) and particular NDD groups. Similarities between particular NDD groups and similarities of NDD groups with the CTRL group were evaluated by comparing DGGE profiles of samples from particular NDD groups, obtained by universal, LB-, BB-specific primers and all three sets of primers together, between NDD groups (E–H) and with DGGE profiles of the CTRL group (I–L), respectively. Relevant statistical values of Dice analysis are presented in Supplementary Table 3. *p < 0.05; **p < 0.01; ***p < 0.001; ****p < 0.0001.

