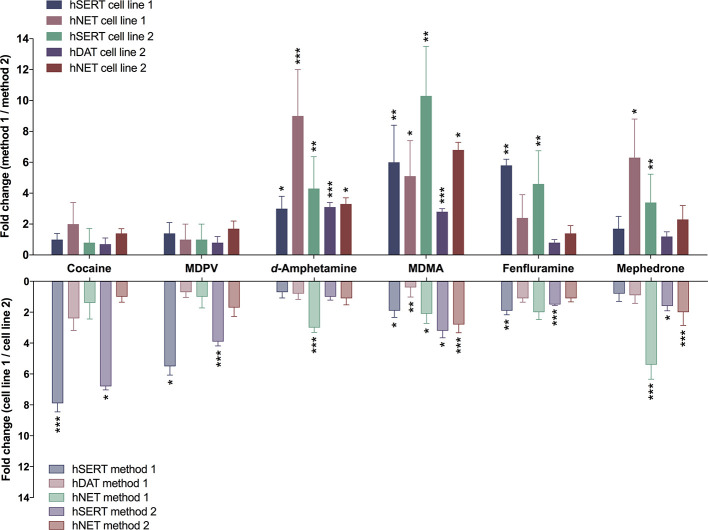
Figure 1.
Differences in transporter inhibition when assessed with different methods or in different cell lines. Bars represent fold-change of IC50 values determined either with different methods (upper section) or with different cell lines [lower section; method 1 (adherent cells); method 2 (cells in suspension)]. Ratios were calculated from the IC50 values present in Table 2 . Error bars represent error propagation from the division of two values. Asterisks indicate significant differences between two methods or two (cell lines used (*P < 0.05, **P < 0.01, ***P < 0.001; unpaired two-tailed t-test; Supplementary Tables 1 and 2 ).

