FIGURE 1.
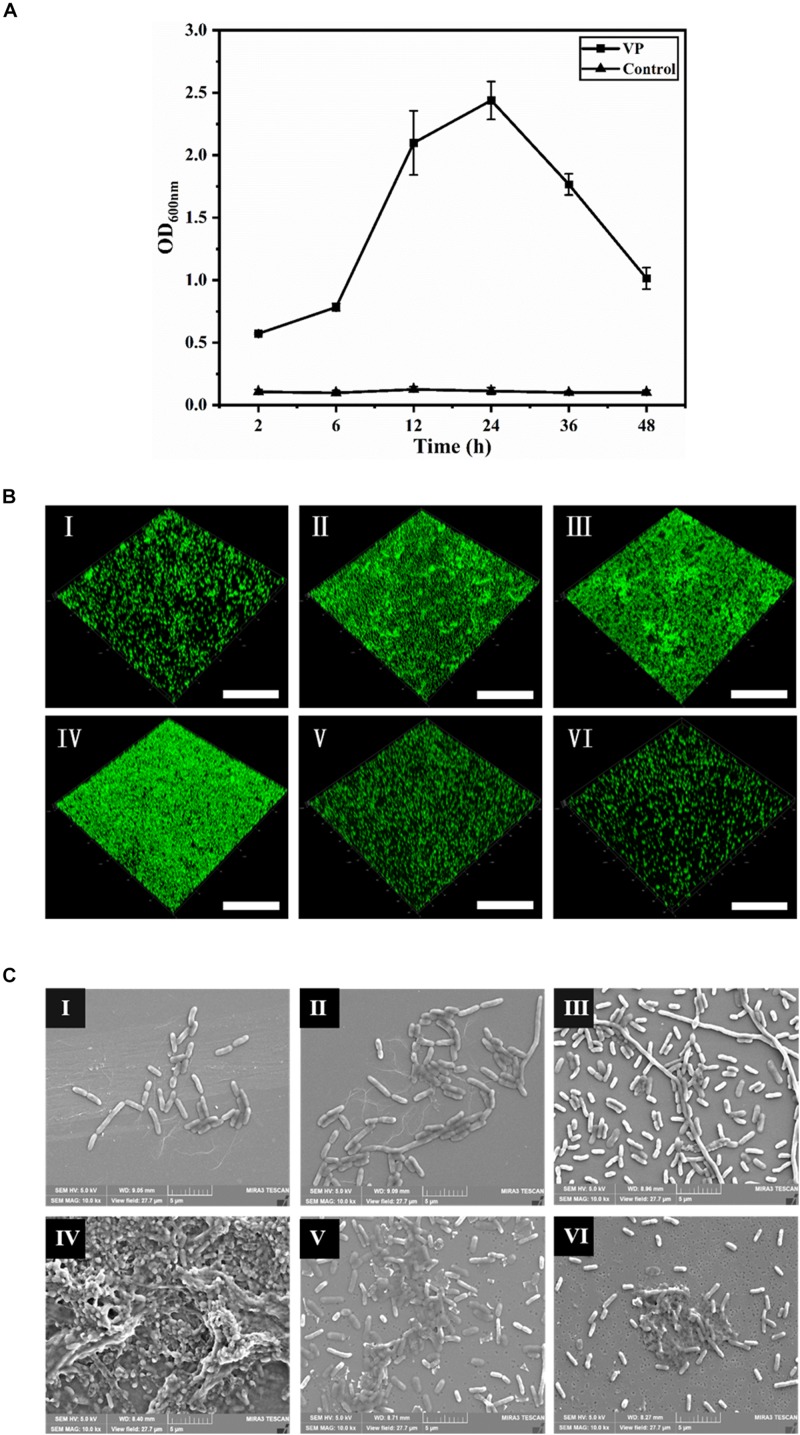
The dynamic process of V. parahaemolyticus biofilm formation. (A) Biofilm biomass was measured by crystal violet binding at an OD600 after static culture for different times (2, 6, 12, 24, 36, and 48 h). Error bars show standard deviations of three independent experiments. (B) Confocal laser scanning microscopic images of V. parahaemolyticus biofilm development process. The scale bar represents 100 μm. (C) Scanning electron microscopic images of microstructure during the development of V. parahaemolyticus biofilm. The scale bar represents 5 μm. I–VI represent 2, 6, 12, 24, 36, and 48 h, respectively. Pictures are representative of three independent experiments with at least three replicates each.

