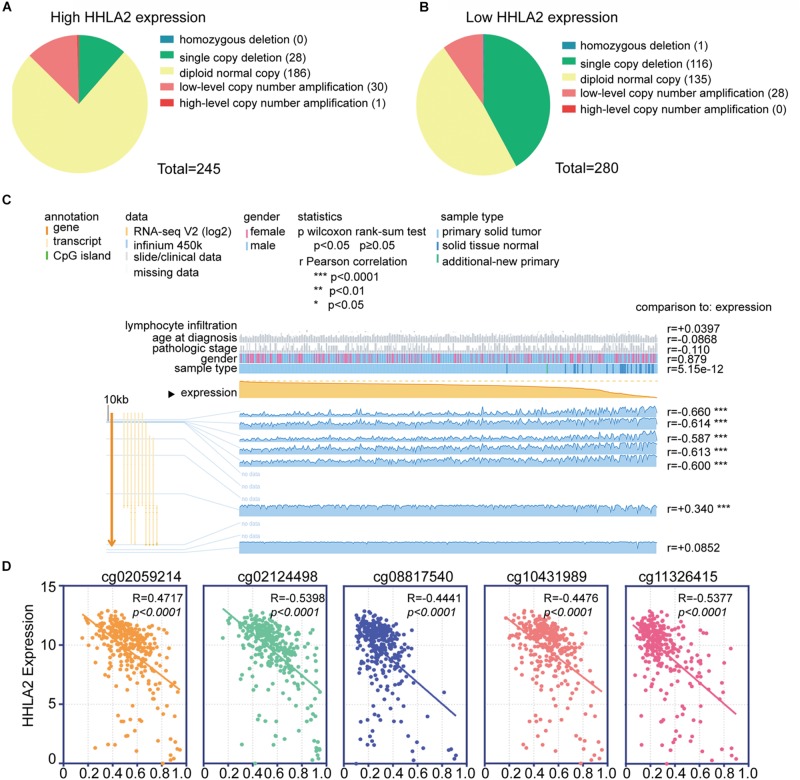
FIGURE 3.
Analysis of the potential genetic and epigenetic alterations associated with HHLA2 dysregulation. (A,B) The CNAs in HHLA2-high and low expression groups. (C) Analysis of CpG island methylation and abnormal HHLA2 expression using TCGA dataset. (D) Correlation between HHLA2 expression and CpG island methylation was performed. ****P < 0.0001.

