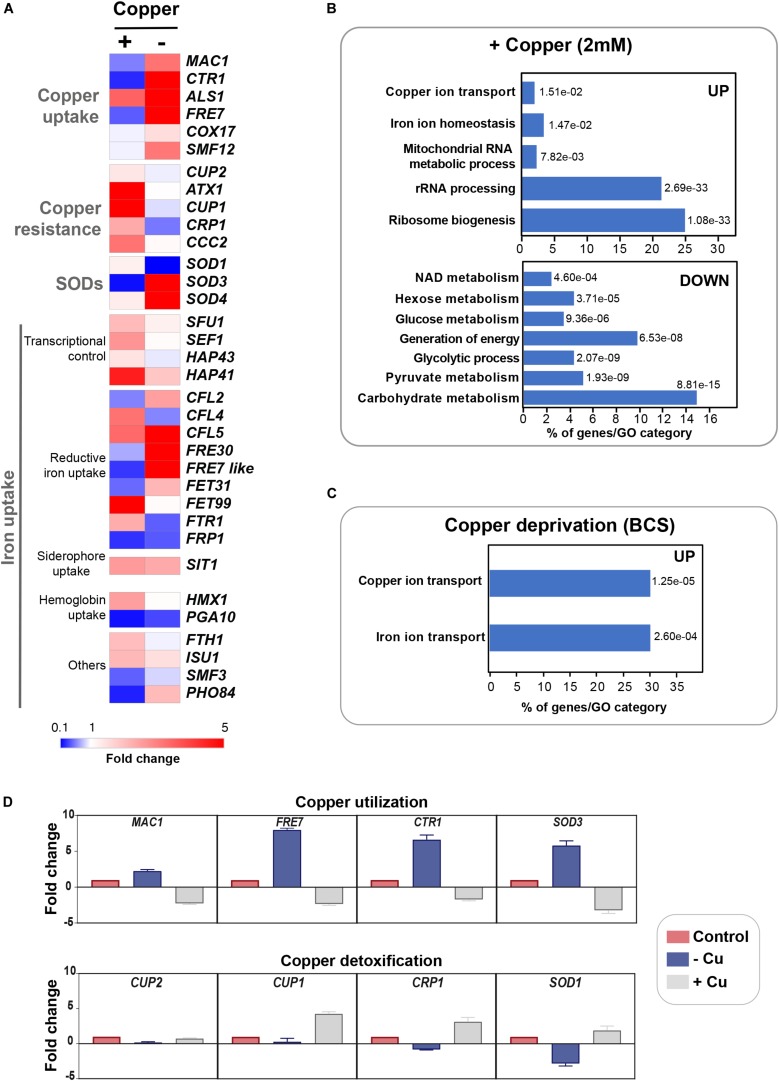
FIGURE 1.
Genome-wide transcriptional profiling of C. albicans to Cu variations by RNA-seq. (A) Heat map visualization of the transcript levels of the Cu homeostasis pathway in C. albicans in response to Cu excess and deprivation. C. albicans WT cells were exposed to either 2 mM CuSO4 or 400 μM BCS, and incubated at 30°C for 30 min. Transcripts associated with both Cu utilization (copper “–”) and detoxification (copper “+”) were identified by comparing the transcriptional profiles of WT cells treated with BCS and CuSO4, respectively, to that of non-treated WT cells. (B,C) Gene function and biological process enriched in the transcriptional profiles of C. albicans growing under Cu excess (B) and limitation (C). (D) qPCR validation of RNA-seq data. Transcript levels of both Cu utilization (MAC1, CTR1, FRE7, and SOD3) and detoxification (CUP1, CRP1, SOD1, and CUP2) genes were assessed and fold-changes were calculated using the comparative ΔΔCt method. Data were normalized using Ct values obtained from actin gene in each condition.

