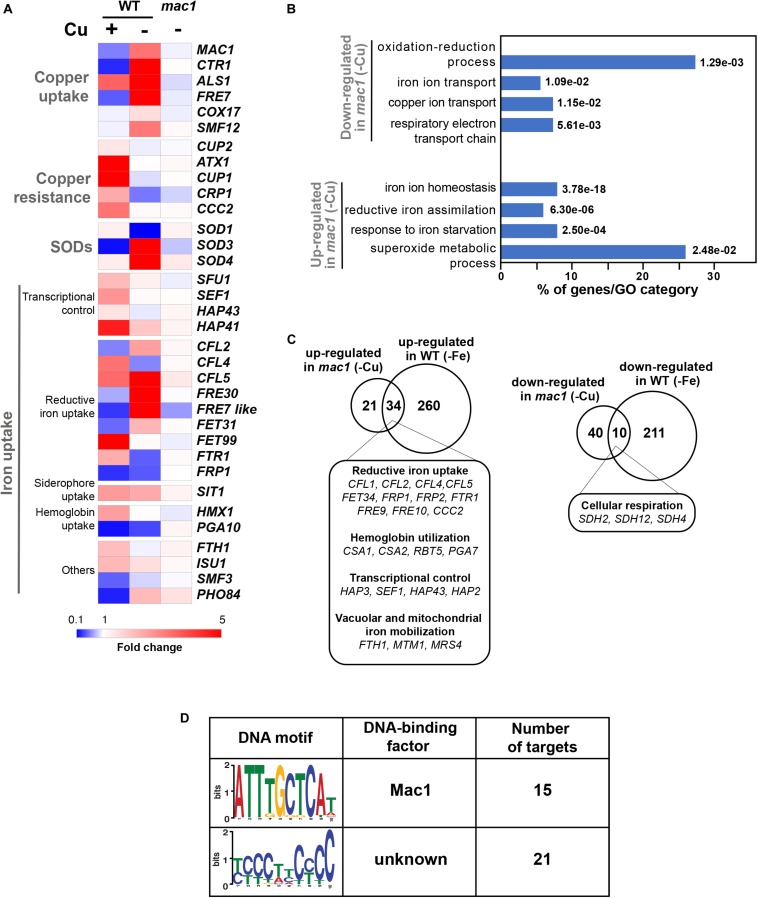
FIGURE 4.
The Mac1-dependant control of Cu deprivation transcriptome. (A) Transcriptional alterations of Cu homeostasis genes in both WT and mac1. Heatmap visualization was presented as in Figure 1A for the WT and includes mac1 RNA-seq data. As the WT strain, mac1 mutant were exposed to 400 μM BCS, and incubated at 30°C for 30 min. Mac1-dependant transcripts associated with Cu utilization were identified by comparing the transcriptional profile of mac1 cells exposed to BCS to that of non-treated mac1 cells. (B) Gene ontology analysis of upregulated and downregulated transcripts in mac1 in response to BSC. The p-values were calculated using hypergeometric distribution. (C) Comparison of the Cu- and the iron-depletion transcriptomes of C. albicans (from Chen et al., 2011). Venn diagrams summarize the similarity between up- and downregulated transcripts under both iron and Cu starvations. Functional gene categories enriched in both conditions are indicated. (D) De novo prediction of DNA cis-regulatory motif enriched in the 50 gene promoters that mac1 failed to activate using MEME analysis tool (http://meme-suite.org).

