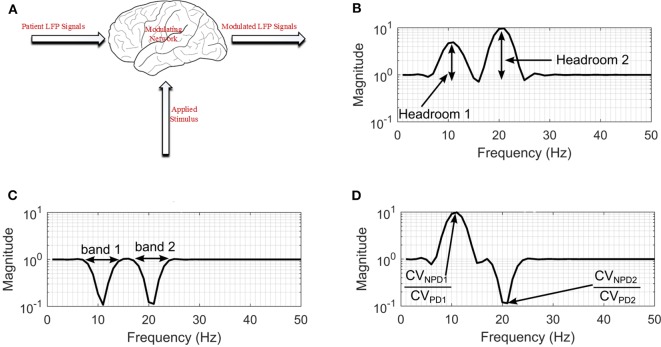
Figure 3.
Modulating network used to simulate the effect of DBS on neuronal signals. (A) Basal-ganglia network model. (B) Frequency response for configuration with non-PD having higher amplitude in both bands. (C) Frequency response for a configuration with PD having higher amplitude in both bands. (D) Frequency response for a configuration with non-PD having higher amplitude in band 1, and PD having higher amplitudes in band 2. CVNPD is the coefficient of variation for non-PD LFP signal and CVPD is the coefficient of variation for PD LFP signal.

