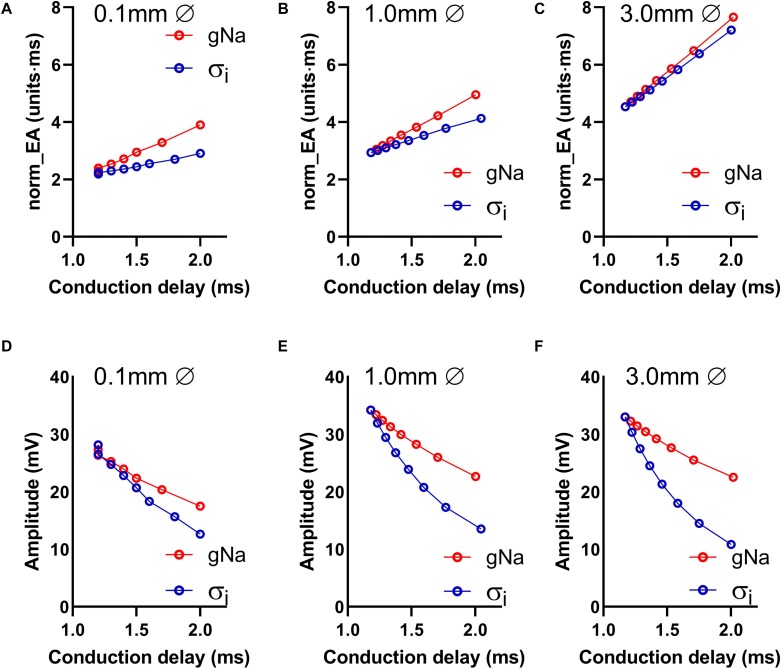
FIGURE 4.
Influence of altered sodium channel conductance and intracellular conductivity on electrogram morphology and its relationship with local conduction delay. (A–C) Data showing the impact of altering electrode diameter on the relationship between normalized electrogram area (norm_EA) and local tissue conduction delay with altered sodium channel conductance (gNa)/intracellular conductivity (σi) in a computational model of a propagating mouse ventricular action potential. Data are shown for three different electrode diameters. (D–F) The same data for bipolar electrogram amplitude.

