FIGURE 8.
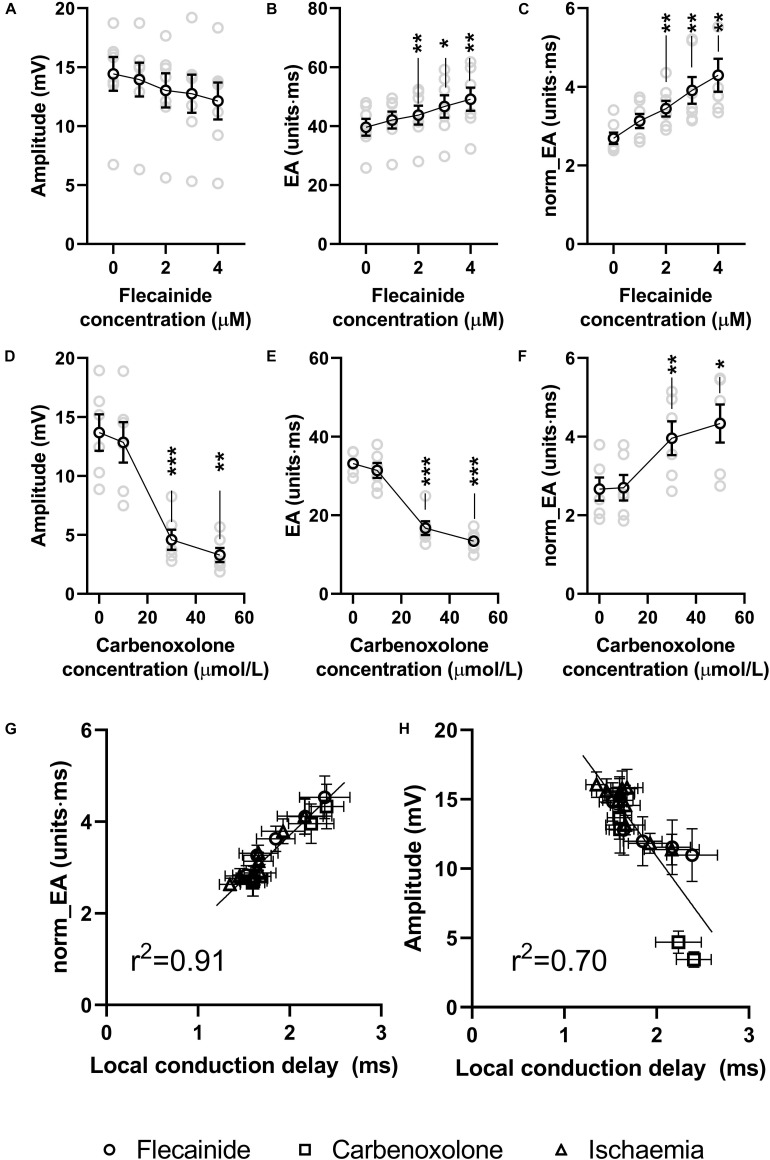
Effects of sodium channel blockade and gap junction inhibition on electrogram morphology in isolated mouse hearts. (A–C) Data showing the effects of increasing concentrations of flecainide on bipolar electrogram amplitude, absolute electrogram area (EA) and normalized EA (norm_EA). (D–F) The same panels but for increasing concentrations of carbenoxolone. (G,H) Correlation between norm_EA and local activation delay (as assessed from the difference in activation time between adjacent electrodes/unipolar electrograms). Difference from 0 μmol/L; *p < 0.05, **p < 0.01, ***p < 0.001. Data are mean ± SEM. Actual replicates are shown in gray. n = 6,7 hearts per group.

