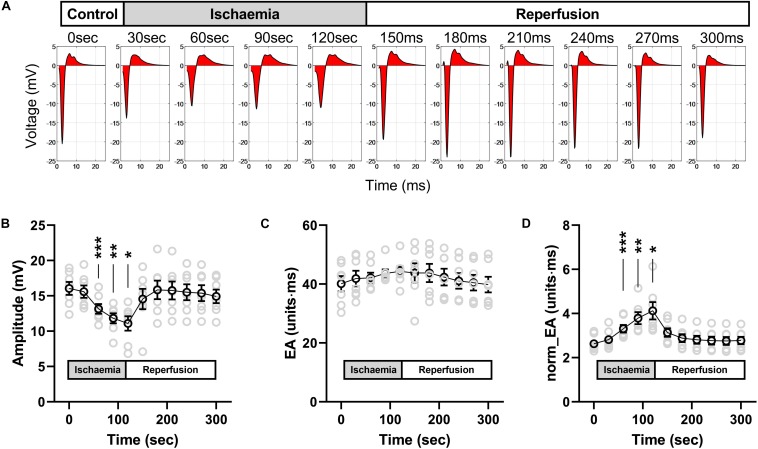
FIGURE 9.
Effects of low-flow ischemia on electrogram morphology in isolated mouse hearts. Changes in electrogram morphology during low-flow global ischemia in perfused mouse hearts. (A) Representative bipolar electrogram recordings showing the change in electrogram morphology during a 120-s period of low-flow ischemia and subsequent tissue reperfusion in a single mouse heart. The red shading indicates the calculated electrogram area. (B–D) Mean data from seven mouse hearts showing the changes in bipolar electrogram amplitude (B), absolute electrogram area (EA) (C), and amplitude-normalized EA (norm_EA) (D) in response to ischemia-reperfusion. Different from 0; *p < 0.05, **p < 0.01, ***p < 0.001. Data are mean ± SEM. Actual replicates are shown in gray. n = 7 hearts.

