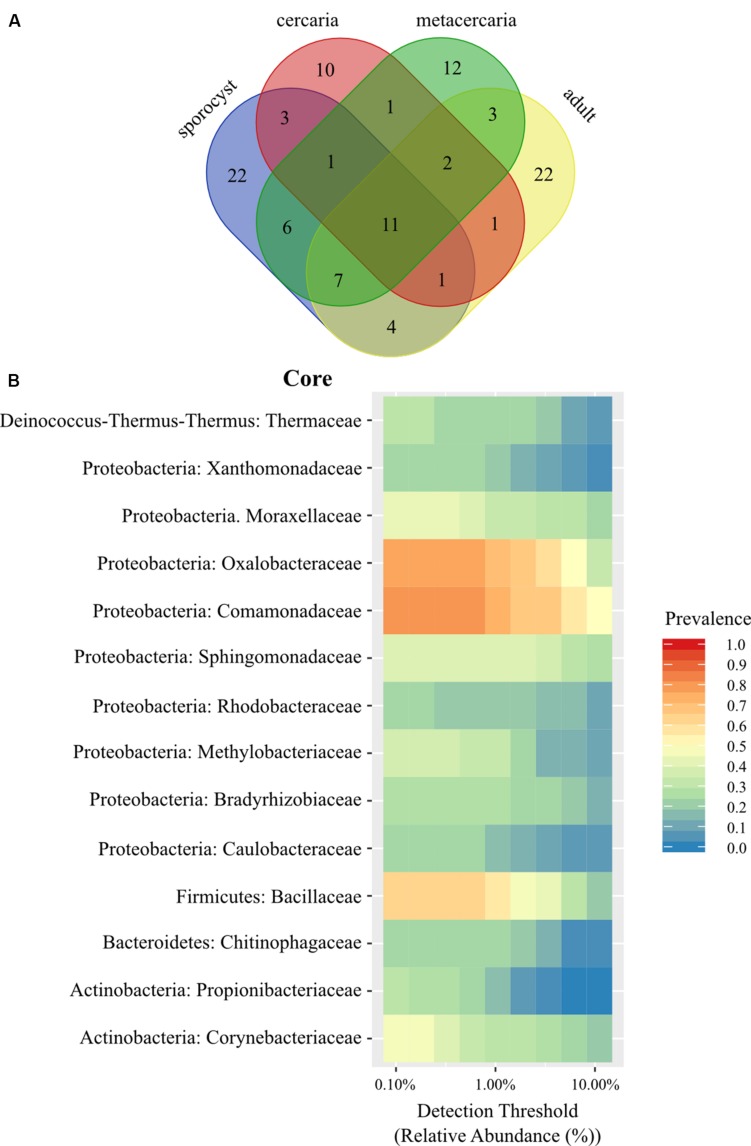
FIGURE 1.
(A) Venn diagram showing the number of shared bacterial families among life stages of the trematode parasite Coitocaecum parvum. (B) Heat map of the bacterial phylogenetic core of C. parvum at family level (within respective phylum) as a function of the abundance threshold for taxa with prevalence above 0.2. The x-axis represents the detection thresholds (indicated as relative abundance) from lower (left) to higher (right) abundance values. Color shading indicates the prevalence of each bacterial family among samples for each abundance threshold. As we increase the detection threshold, the prevalence decreases.

