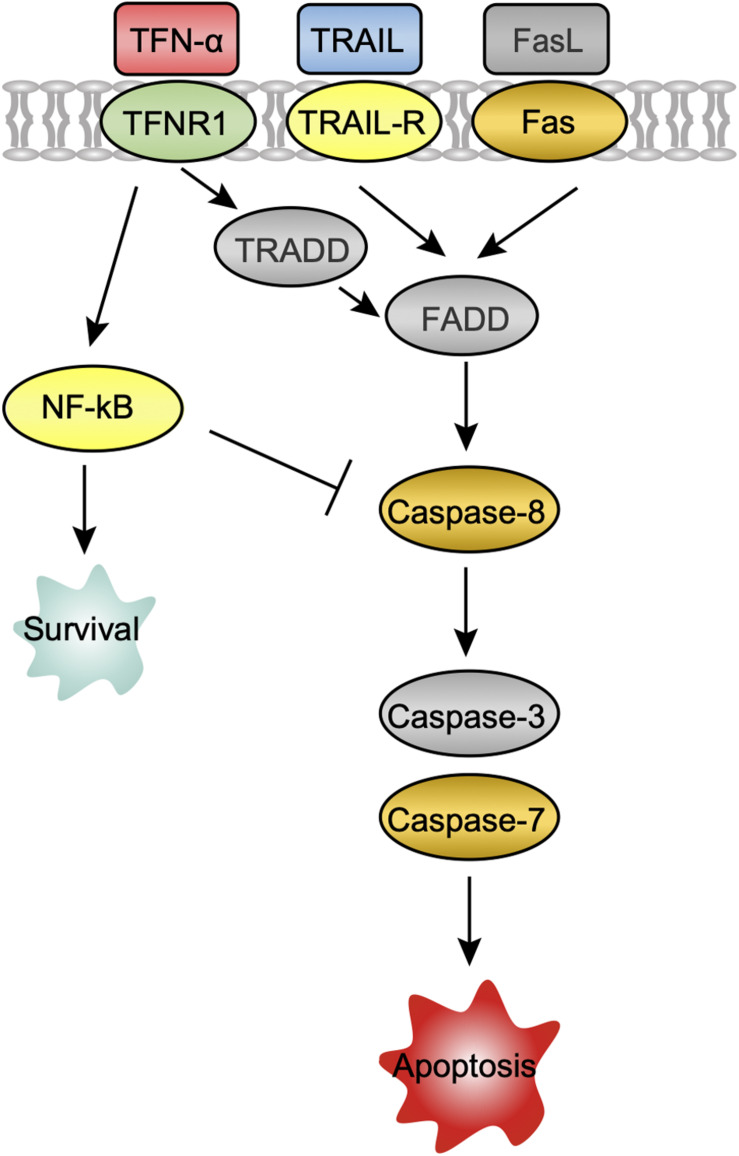
FIGURE 3.
A potential apoptosis pathway in PaKi cells following CedV infection. The challenge groups in which genes were upregulated at 24 hpi are indicated with color. Red: CedV-infected PaKi cells only; Green: CedV-infected HeLa and PaKi cells; Blue: HeV- or CedV-infected PaKi cells; Orange: HeV- or CedV-infected PaKi cells and CedV-infected HeLa cells; Yellow: HeV- or CedV-infected HeLa and PaKi cells. Genes that were not upregulated in any challenge group at 24 hpi are colored gray.

