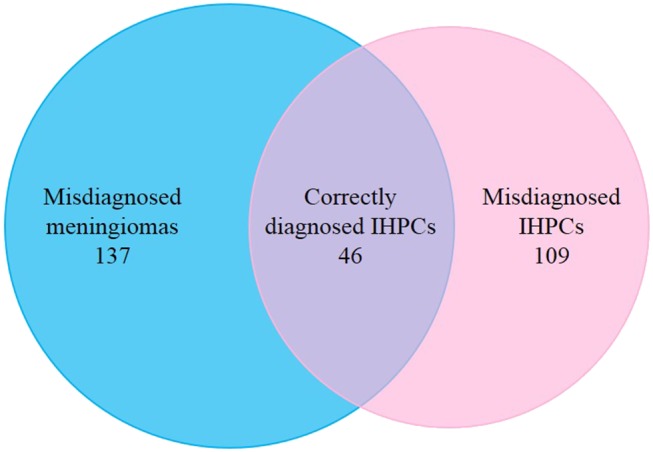
Figure 1.

Distribution of enrolled patients. Left circle represents cases of radiologically diagnosed IHPCs; right circle represents cases of pathologically diagnosed IHPCs. Intersection (purple) of two circles represents 46 cases of enrolled IHPCs, which were correctly diagnosed by radiology; 137 cases of pathologically diagnosed meningiomas were radiologically misdiagnosed as IHPCs (blue); 109 cases of pathological diagnosed IHPCs were radiologically misdiagnosed as meningiomas (pink).
