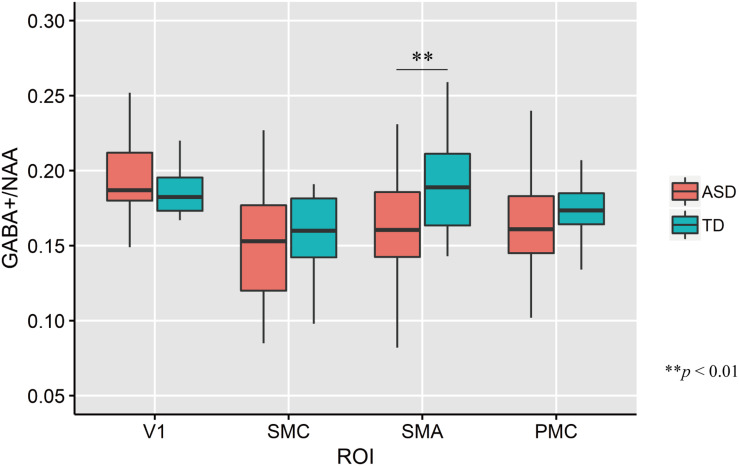
FIGURE 3.
Distribution of GABA+/NAA ratio of every ROIs in each group. The upper and lower boundaries of the standard boxplots represent the 25th and 75th percentiles. The horizontal line across the box marks the median of the distribution. The ends of vertical lines below and above the box represent the minimum and maximum values, respectively. Asterisks represent significant difference by two-tailed t test. V1, the bilateral primary visual cortices; SMC, the left sensory motor cortex; SMA, the left supplementary motor area; PMC, the left ventral premotor cortex.

