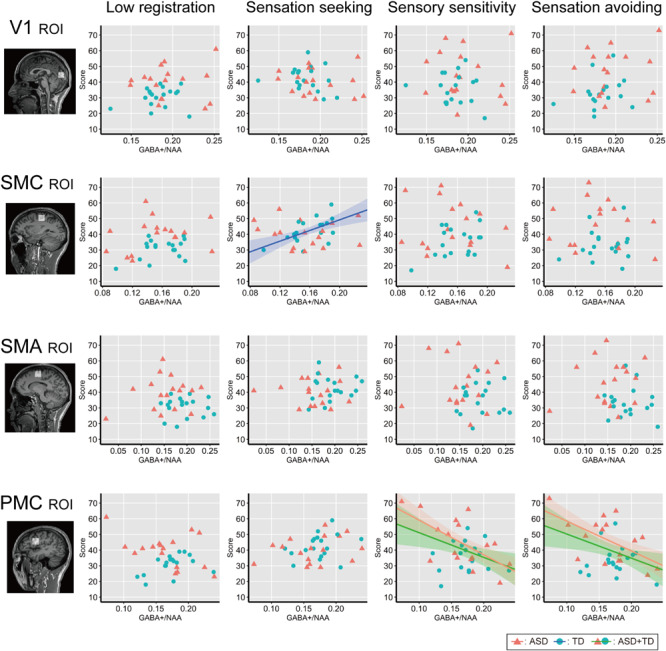
FIGURE 4.

Correlation analysis between individual AASP and GABA+ level. Individual sub-scale scores are plotted against individual GABA+ /NAA ratio in each ROI. Red triangles indicate ASD individuals and blue circles indicate TD individuals. Shaded bands represent 95% confidence intervals across individuals for each group (green: all participants, red: ASD group, blue: TD group). V1, the bilateral primary visual cortices; SMC, the left sensory motor cortex; SMA, the left supplementary motor area; PMC, the left ventral premotor cortex.
