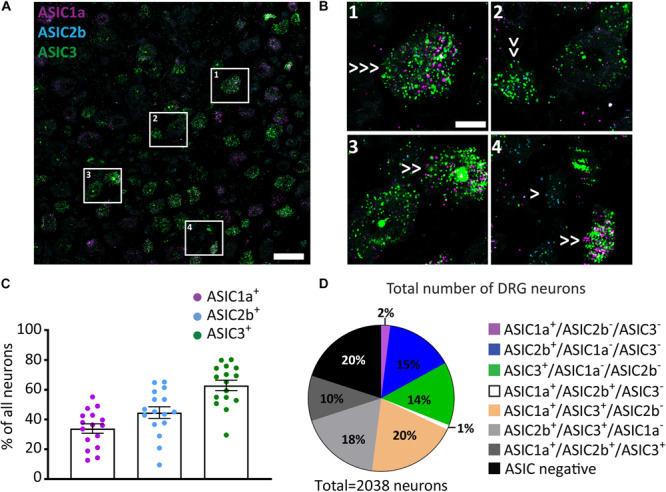
FIGURE 3.

ASIC1a, ASIC2b, and ASIC3 co-expression in DRG neurons. (A) A representative confocal image from a DRG section showing expression of ASIC1a, ASIC2b, and ASIC3. Scale bar = 50 μm. (B) Images of the regions in left panel highlighted with white rectangles at high magnification. Single arrows point to cells expressing only one ASIC subunit, double arrows point to cells expressing two subunits, and triple arrows point to cells expressing all three subunits. Scale bar = 20 μm. (C) Percentage of all DRG neurons expressing different ASIC subunits. (D) Pie chart showing the distribution of DRG neurons expressing different combinations of ASIC1a, ASIC2b, and ASIC3; n = 16 DRG sections from 4 mice.
