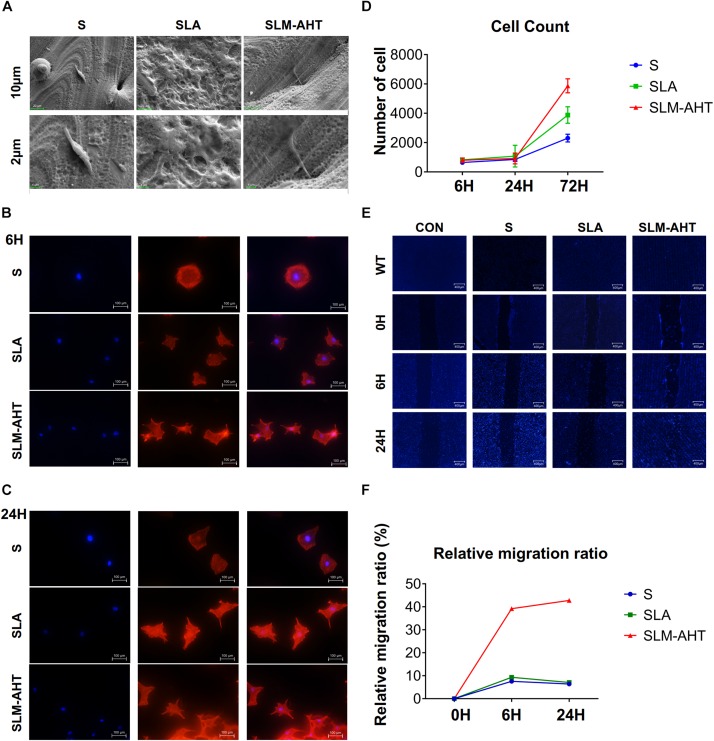
FIGURE 2.
Surface topography influences cell adhesion, proliferation and migration. (A) SEM observation of pseudopodia of cell extending on S, SLA, and SLM-AHT titanium surfaces after 6 h of seeding. (B,C) Immunofluorescence images of cell (red, F-actin; blue, DAPI) on S, SLA and SLM-AHT titanium surfaces after 6 and 24 h of seeding. (D) Cell count on S, SLA and SLM-AHT titanium surfaces for 6, 24, and 72 h. (E) Scratch assay of cell on different groups culturing for 0, 6, and 24 h visualized via DAPI (blue) staining. (F) Relative closure determined by measuring wound widths from images (E) in the upper panel.

