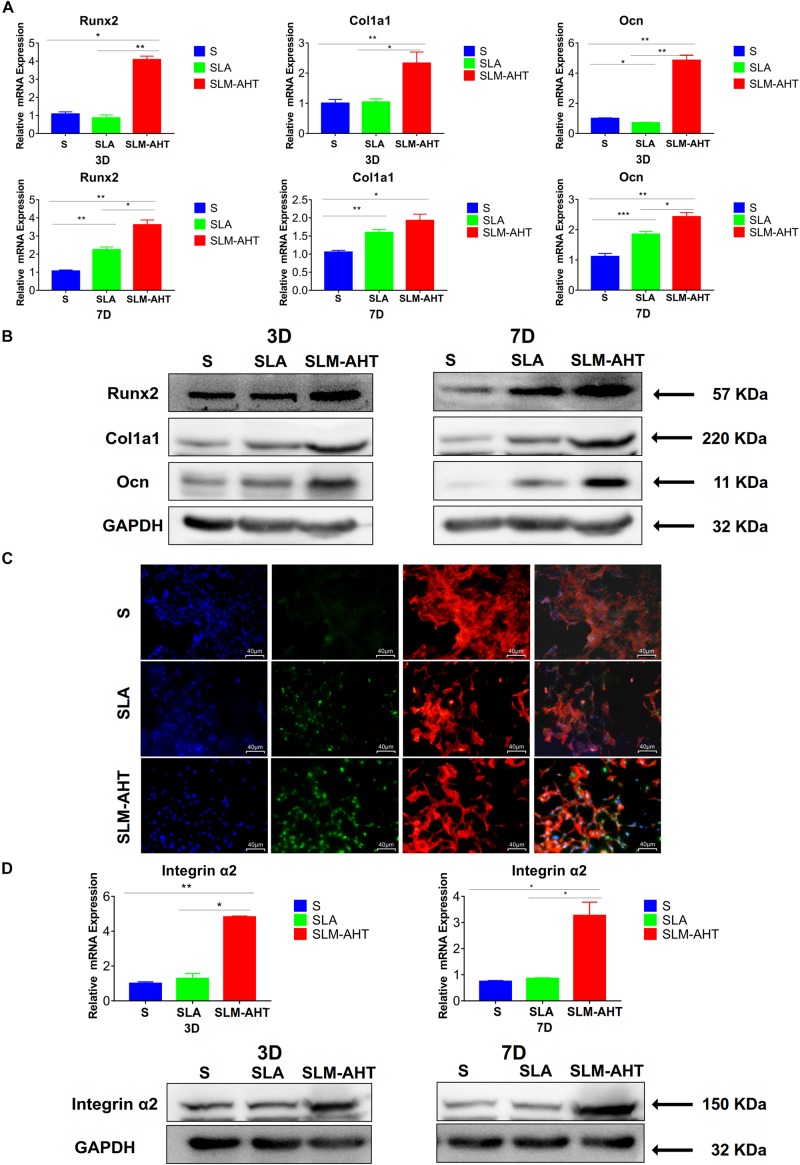
FIGURE 5.
Surface topography influences cell osteogenic differentiation. (A) The relative mRNA levels of Runx2, Col1a1 and Ocn in cell cultured on different materials for 3 and 7 days. (B) Western blot analysis of Runx2, Col1a1, and Ocn in cell cultured on different materials for 3 and 7 days. (C) Immunofluorescence staining showing surface topography dependent diverse expression of Runx2 in cell cultured on different materials for 3 days. (red, F-actin; blue, DAPI; green, Runx2). (D) The relative mRNA and protein levels of integrin α2 in cell cultured on different materials for 3 and 7 days. Statistical significance was determined by one-way ANOVA. Error bars represent SD (n = 3). *P < 0.05, **P < 0.01, ***P < 0.005.

