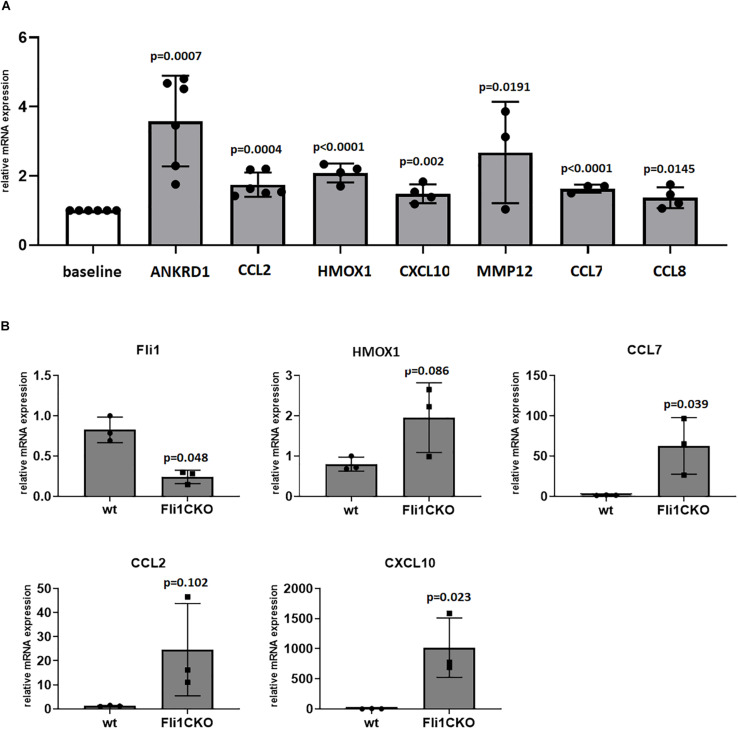
FIGURE 7.
Validation of differentially expressed genes via quatitative RT-PCR. Results in THP1 cells treated with siRNA in (A) or peritoneal macrophages isolated from Fli1CKO mice and wt mice in (B). mRNA levels of selected genes of interest were analyzed by RT-PCR in ≥3 separate experiments and the results are presented as bar graphs with controls arbitrarily set at 1. scr, scrambled.

